Immigrants from Grenada vs Immigrants from Moldova 11th Grade
COMPARE
Immigrants from Grenada
Immigrants from Moldova
11th Grade
11th Grade Comparison
Immigrants from Grenada
Immigrants from Moldova
90.1%
11TH GRADE
0.0/ 100
METRIC RATING
294th/ 347
METRIC RANK
93.7%
11TH GRADE
99.5/ 100
METRIC RATING
81st/ 347
METRIC RANK
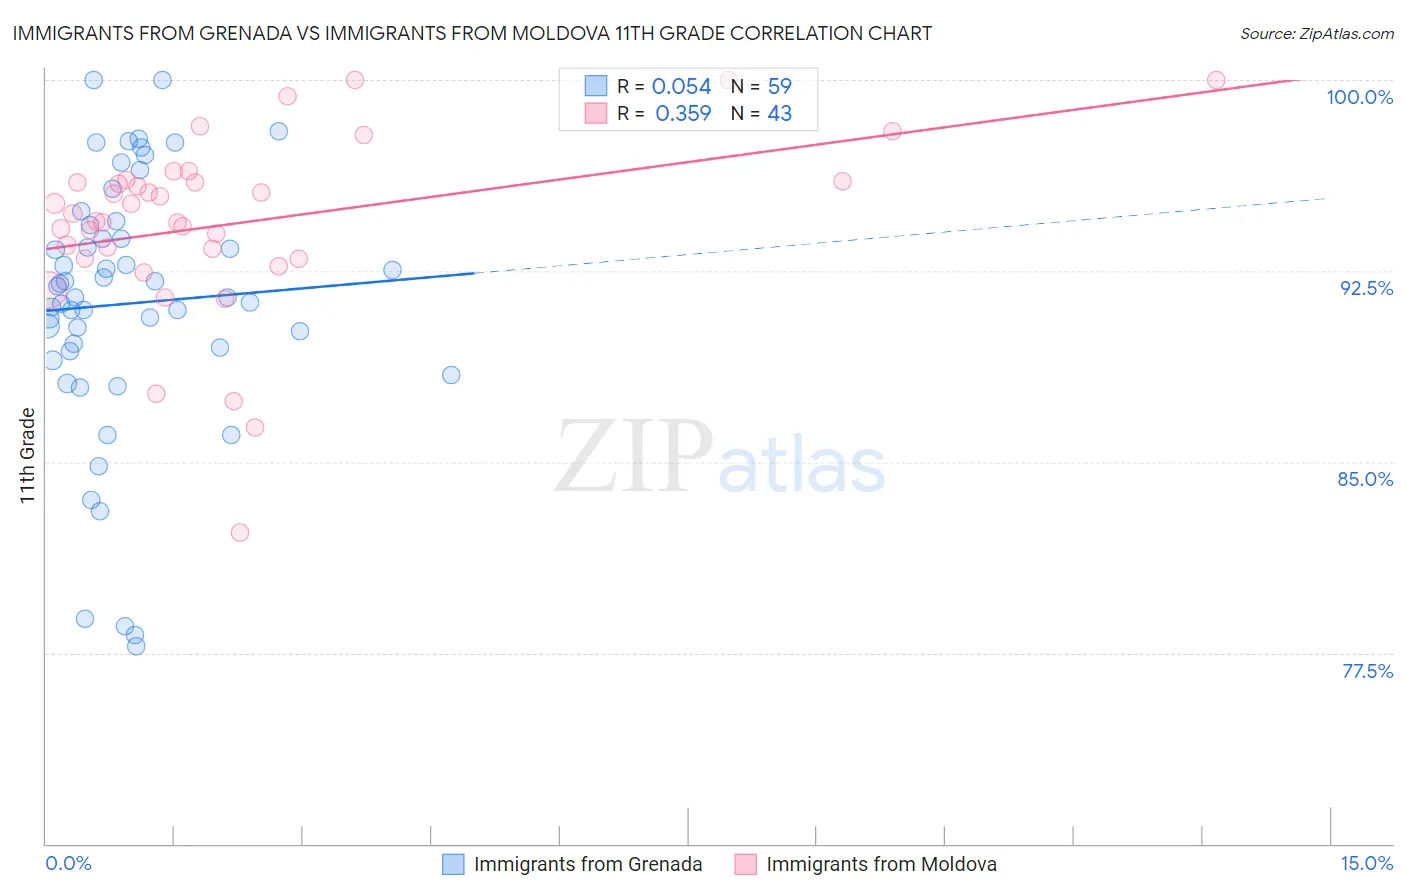
Immigrants from Grenada vs Immigrants from Moldova 11th Grade Correlation Chart
The statistical analysis conducted on geographies consisting of 67,201,908 people shows a slight positive correlation between the proportion of Immigrants from Grenada and percentage of population with at least 11th grade education in the United States with a correlation coefficient (R) of 0.054 and weighted average of 90.1%. Similarly, the statistical analysis conducted on geographies consisting of 124,399,411 people shows a mild positive correlation between the proportion of Immigrants from Moldova and percentage of population with at least 11th grade education in the United States with a correlation coefficient (R) of 0.359 and weighted average of 93.7%, a difference of 4.0%.
11th Grade Correlation Summary
| Measurement | Immigrants from Grenada | Immigrants from Moldova |
| Minimum | 77.8% | 82.2% |
| Maximum | 100.0% | 100.0% |
| Range | 22.2% | 17.8% |
| Mean | 91.2% | 94.4% |
| Median | 91.5% | 94.8% |
| Interquartile 25% (IQ1) | 89.4% | 93.0% |
| Interquartile 75% (IQ3) | 94.3% | 96.0% |
| Interquartile Range (IQR) | 5.0% | 3.0% |
| Standard Deviation (Sample) | 5.1% | 3.6% |
| Standard Deviation (Population) | 5.1% | 3.5% |
Similar Demographics by 11th Grade
Demographics Similar to Immigrants from Grenada by 11th Grade
In terms of 11th grade, the demographic groups most similar to Immigrants from Grenada are Native/Alaskan (90.2%, a difference of 0.050%), Immigrants from Vietnam (90.0%, a difference of 0.11%), Cuban (90.2%, a difference of 0.12%), Fijian (90.0%, a difference of 0.12%), and Haitian (90.3%, a difference of 0.14%).
| Demographics | Rating | Rank | 11th Grade |
| Apache | 0.0 /100 | #287 | Tragic 90.4% |
| Pennsylvania Germans | 0.0 /100 | #288 | Tragic 90.3% |
| British West Indians | 0.0 /100 | #289 | Tragic 90.3% |
| Indonesians | 0.0 /100 | #290 | Tragic 90.3% |
| Haitians | 0.0 /100 | #291 | Tragic 90.3% |
| Cubans | 0.0 /100 | #292 | Tragic 90.2% |
| Natives/Alaskans | 0.0 /100 | #293 | Tragic 90.2% |
| Immigrants | Grenada | 0.0 /100 | #294 | Tragic 90.1% |
| Immigrants | Vietnam | 0.0 /100 | #295 | Tragic 90.0% |
| Fijians | 0.0 /100 | #296 | Tragic 90.0% |
| Navajo | 0.0 /100 | #297 | Tragic 90.0% |
| Immigrants | Fiji | 0.0 /100 | #298 | Tragic 89.9% |
| Japanese | 0.0 /100 | #299 | Tragic 89.9% |
| Immigrants | Haiti | 0.0 /100 | #300 | Tragic 89.9% |
| Guyanese | 0.0 /100 | #301 | Tragic 89.9% |
Demographics Similar to Immigrants from Moldova by 11th Grade
In terms of 11th grade, the demographic groups most similar to Immigrants from Moldova are Canadian (93.7%, a difference of 0.0%), Immigrants from Denmark (93.7%, a difference of 0.020%), Aleut (93.7%, a difference of 0.030%), Soviet Union (93.7%, a difference of 0.030%), and Celtic (93.7%, a difference of 0.040%).
| Demographics | Rating | Rank | 11th Grade |
| Immigrants | Czechoslovakia | 99.6 /100 | #74 | Exceptional 93.8% |
| Immigrants | Latvia | 99.6 /100 | #75 | Exceptional 93.8% |
| Celtics | 99.5 /100 | #76 | Exceptional 93.7% |
| Aleuts | 99.5 /100 | #77 | Exceptional 93.7% |
| Soviet Union | 99.5 /100 | #78 | Exceptional 93.7% |
| Immigrants | Denmark | 99.5 /100 | #79 | Exceptional 93.7% |
| Canadians | 99.5 /100 | #80 | Exceptional 93.7% |
| Immigrants | Moldova | 99.5 /100 | #81 | Exceptional 93.7% |
| Immigrants | Saudi Arabia | 99.3 /100 | #82 | Exceptional 93.7% |
| Icelanders | 99.3 /100 | #83 | Exceptional 93.6% |
| Immigrants | Taiwan | 99.3 /100 | #84 | Exceptional 93.6% |
| Immigrants | Switzerland | 99.3 /100 | #85 | Exceptional 93.6% |
| Immigrants | South Central Asia | 99.2 /100 | #86 | Exceptional 93.6% |
| Immigrants | Western Europe | 99.2 /100 | #87 | Exceptional 93.6% |
| Cambodians | 99.2 /100 | #88 | Exceptional 93.6% |