Immigrants from Grenada vs Immigrants from Iran 11th Grade
COMPARE
Immigrants from Grenada
Immigrants from Iran
11th Grade
11th Grade Comparison
Immigrants from Grenada
Immigrants from Iran
90.1%
11TH GRADE
0.0/ 100
METRIC RATING
294th/ 347
METRIC RANK
93.5%
11TH GRADE
98.9/ 100
METRIC RATING
97th/ 347
METRIC RANK
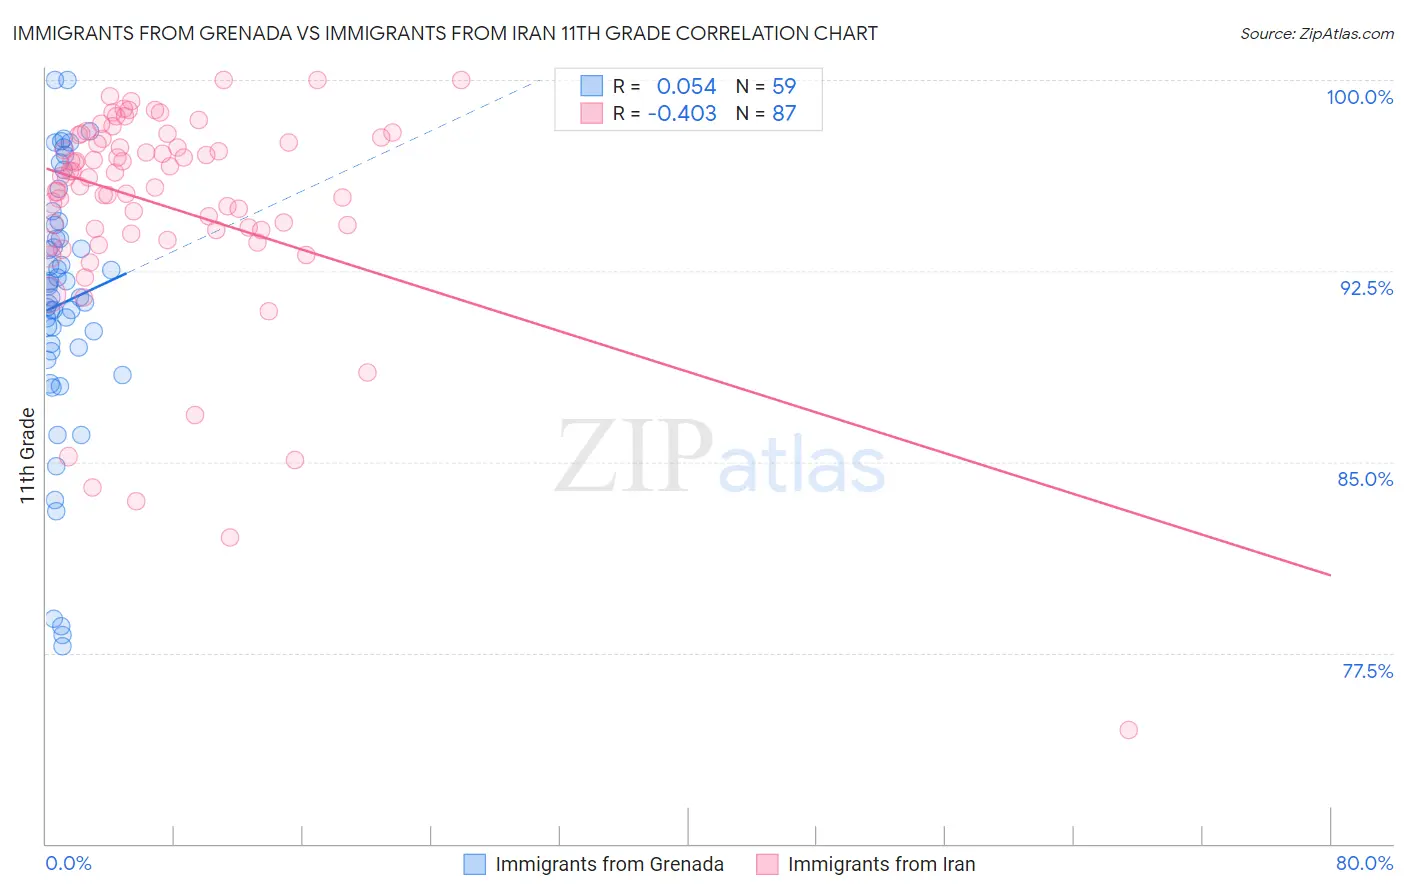
Immigrants from Grenada vs Immigrants from Iran 11th Grade Correlation Chart
The statistical analysis conducted on geographies consisting of 67,201,908 people shows a slight positive correlation between the proportion of Immigrants from Grenada and percentage of population with at least 11th grade education in the United States with a correlation coefficient (R) of 0.054 and weighted average of 90.1%. Similarly, the statistical analysis conducted on geographies consisting of 279,905,207 people shows a moderate negative correlation between the proportion of Immigrants from Iran and percentage of population with at least 11th grade education in the United States with a correlation coefficient (R) of -0.403 and weighted average of 93.5%, a difference of 3.8%.
11th Grade Correlation Summary
| Measurement | Immigrants from Grenada | Immigrants from Iran |
| Minimum | 77.8% | 74.5% |
| Maximum | 100.0% | 100.0% |
| Range | 22.2% | 25.5% |
| Mean | 91.2% | 95.0% |
| Median | 91.5% | 96.2% |
| Interquartile 25% (IQ1) | 89.4% | 94.1% |
| Interquartile 75% (IQ3) | 94.3% | 97.7% |
| Interquartile Range (IQR) | 5.0% | 3.6% |
| Standard Deviation (Sample) | 5.1% | 4.3% |
| Standard Deviation (Population) | 5.1% | 4.3% |
Similar Demographics by 11th Grade
Demographics Similar to Immigrants from Grenada by 11th Grade
In terms of 11th grade, the demographic groups most similar to Immigrants from Grenada are Native/Alaskan (90.2%, a difference of 0.050%), Immigrants from Vietnam (90.0%, a difference of 0.11%), Cuban (90.2%, a difference of 0.12%), Fijian (90.0%, a difference of 0.12%), and Haitian (90.3%, a difference of 0.14%).
| Demographics | Rating | Rank | 11th Grade |
| Apache | 0.0 /100 | #287 | Tragic 90.4% |
| Pennsylvania Germans | 0.0 /100 | #288 | Tragic 90.3% |
| British West Indians | 0.0 /100 | #289 | Tragic 90.3% |
| Indonesians | 0.0 /100 | #290 | Tragic 90.3% |
| Haitians | 0.0 /100 | #291 | Tragic 90.3% |
| Cubans | 0.0 /100 | #292 | Tragic 90.2% |
| Natives/Alaskans | 0.0 /100 | #293 | Tragic 90.2% |
| Immigrants | Grenada | 0.0 /100 | #294 | Tragic 90.1% |
| Immigrants | Vietnam | 0.0 /100 | #295 | Tragic 90.0% |
| Fijians | 0.0 /100 | #296 | Tragic 90.0% |
| Navajo | 0.0 /100 | #297 | Tragic 90.0% |
| Immigrants | Fiji | 0.0 /100 | #298 | Tragic 89.9% |
| Japanese | 0.0 /100 | #299 | Tragic 89.9% |
| Immigrants | Haiti | 0.0 /100 | #300 | Tragic 89.9% |
| Guyanese | 0.0 /100 | #301 | Tragic 89.9% |
Demographics Similar to Immigrants from Iran by 11th Grade
In terms of 11th grade, the demographic groups most similar to Immigrants from Iran are Immigrants from Turkey (93.5%, a difference of 0.010%), Immigrants from Israel (93.5%, a difference of 0.020%), Menominee (93.5%, a difference of 0.020%), Swiss (93.6%, a difference of 0.030%), and Immigrants from France (93.6%, a difference of 0.030%).
| Demographics | Rating | Rank | 11th Grade |
| Ottawa | 99.2 /100 | #90 | Exceptional 93.6% |
| South Africans | 99.2 /100 | #91 | Exceptional 93.6% |
| Immigrants | Bulgaria | 99.1 /100 | #92 | Exceptional 93.6% |
| Puget Sound Salish | 99.1 /100 | #93 | Exceptional 93.6% |
| Swiss | 99.0 /100 | #94 | Exceptional 93.6% |
| Immigrants | France | 99.0 /100 | #95 | Exceptional 93.6% |
| Immigrants | Turkey | 98.9 /100 | #96 | Exceptional 93.5% |
| Immigrants | Iran | 98.9 /100 | #97 | Exceptional 93.5% |
| Immigrants | Israel | 98.8 /100 | #98 | Exceptional 93.5% |
| Menominee | 98.7 /100 | #99 | Exceptional 93.5% |
| Immigrants | North Macedonia | 98.7 /100 | #100 | Exceptional 93.5% |
| Immigrants | Romania | 98.7 /100 | #101 | Exceptional 93.5% |
| Chippewa | 98.6 /100 | #102 | Exceptional 93.5% |
| Lebanese | 98.6 /100 | #103 | Exceptional 93.5% |
| Immigrants | Europe | 98.6 /100 | #104 | Exceptional 93.5% |