Immigrants from Grenada vs Immigrants from Spain 11th Grade
COMPARE
Immigrants from Grenada
Immigrants from Spain
11th Grade
11th Grade Comparison
Immigrants from Grenada
Immigrants from Spain
90.1%
11TH GRADE
0.0/ 100
METRIC RATING
294th/ 347
METRIC RANK
92.7%
11TH GRADE
73.0/ 100
METRIC RATING
156th/ 347
METRIC RANK
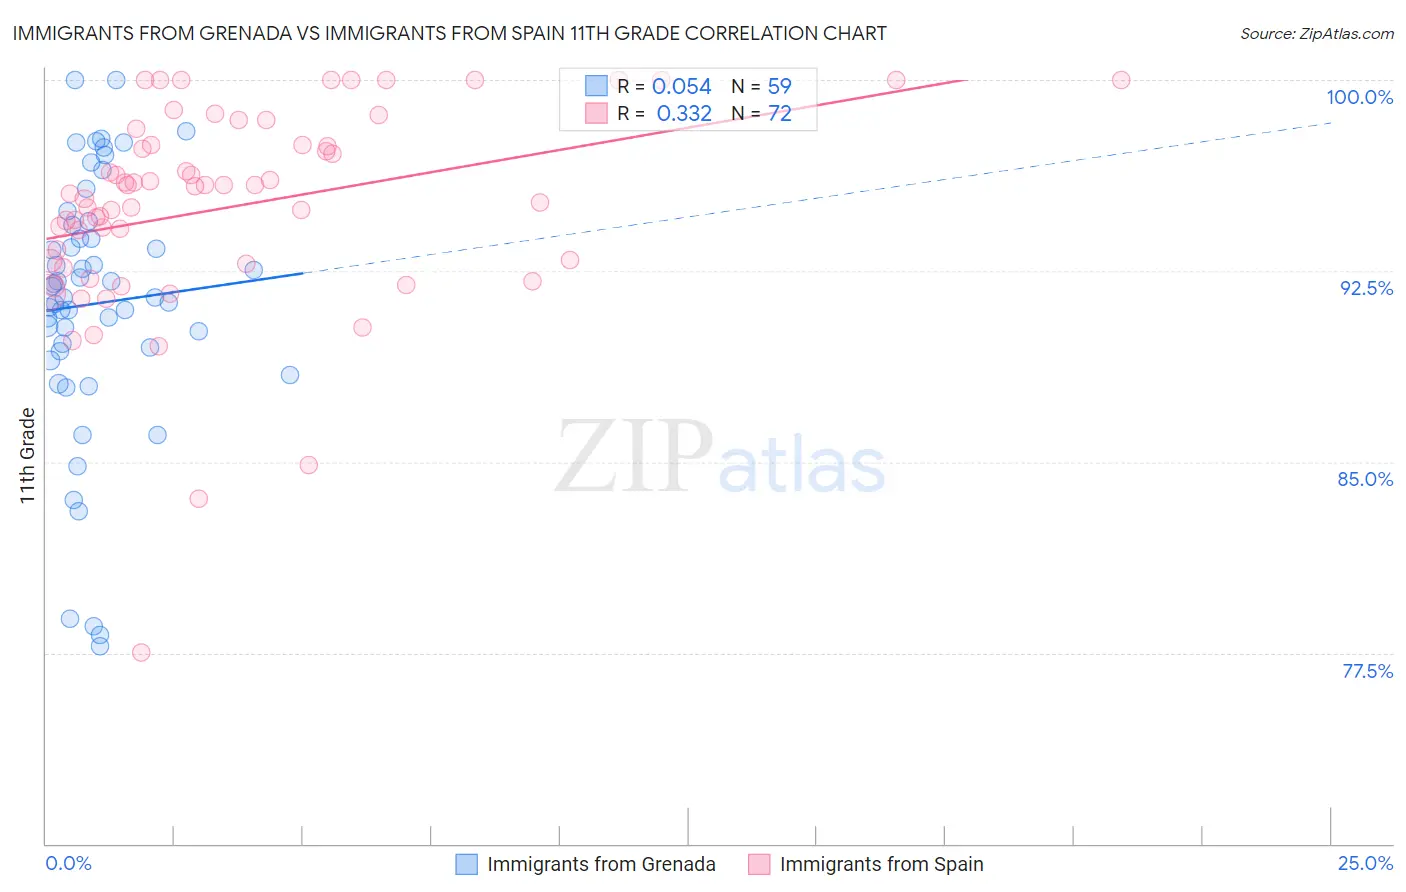
Immigrants from Grenada vs Immigrants from Spain 11th Grade Correlation Chart
The statistical analysis conducted on geographies consisting of 67,201,908 people shows a slight positive correlation between the proportion of Immigrants from Grenada and percentage of population with at least 11th grade education in the United States with a correlation coefficient (R) of 0.054 and weighted average of 90.1%. Similarly, the statistical analysis conducted on geographies consisting of 239,682,725 people shows a mild positive correlation between the proportion of Immigrants from Spain and percentage of population with at least 11th grade education in the United States with a correlation coefficient (R) of 0.332 and weighted average of 92.7%, a difference of 2.9%.
11th Grade Correlation Summary
| Measurement | Immigrants from Grenada | Immigrants from Spain |
| Minimum | 77.8% | 77.5% |
| Maximum | 100.0% | 100.0% |
| Range | 22.2% | 22.5% |
| Mean | 91.2% | 95.0% |
| Median | 91.5% | 95.7% |
| Interquartile 25% (IQ1) | 89.4% | 92.8% |
| Interquartile 75% (IQ3) | 94.3% | 97.4% |
| Interquartile Range (IQR) | 5.0% | 4.6% |
| Standard Deviation (Sample) | 5.1% | 4.0% |
| Standard Deviation (Population) | 5.1% | 4.0% |
Similar Demographics by 11th Grade
Demographics Similar to Immigrants from Grenada by 11th Grade
In terms of 11th grade, the demographic groups most similar to Immigrants from Grenada are Native/Alaskan (90.2%, a difference of 0.050%), Immigrants from Vietnam (90.0%, a difference of 0.11%), Cuban (90.2%, a difference of 0.12%), Fijian (90.0%, a difference of 0.12%), and Haitian (90.3%, a difference of 0.14%).
| Demographics | Rating | Rank | 11th Grade |
| Apache | 0.0 /100 | #287 | Tragic 90.4% |
| Pennsylvania Germans | 0.0 /100 | #288 | Tragic 90.3% |
| British West Indians | 0.0 /100 | #289 | Tragic 90.3% |
| Indonesians | 0.0 /100 | #290 | Tragic 90.3% |
| Haitians | 0.0 /100 | #291 | Tragic 90.3% |
| Cubans | 0.0 /100 | #292 | Tragic 90.2% |
| Natives/Alaskans | 0.0 /100 | #293 | Tragic 90.2% |
| Immigrants | Grenada | 0.0 /100 | #294 | Tragic 90.1% |
| Immigrants | Vietnam | 0.0 /100 | #295 | Tragic 90.0% |
| Fijians | 0.0 /100 | #296 | Tragic 90.0% |
| Navajo | 0.0 /100 | #297 | Tragic 90.0% |
| Immigrants | Fiji | 0.0 /100 | #298 | Tragic 89.9% |
| Japanese | 0.0 /100 | #299 | Tragic 89.9% |
| Immigrants | Haiti | 0.0 /100 | #300 | Tragic 89.9% |
| Guyanese | 0.0 /100 | #301 | Tragic 89.9% |
Demographics Similar to Immigrants from Spain by 11th Grade
In terms of 11th grade, the demographic groups most similar to Immigrants from Spain are Osage (92.7%, a difference of 0.0%), Argentinean (92.7%, a difference of 0.0%), Immigrants from Eastern Asia (92.7%, a difference of 0.0%), Brazilian (92.8%, a difference of 0.010%), and Immigrants from Venezuela (92.7%, a difference of 0.010%).
| Demographics | Rating | Rank | 11th Grade |
| Immigrants | Poland | 78.5 /100 | #149 | Good 92.8% |
| Immigrants | Egypt | 77.5 /100 | #150 | Good 92.8% |
| Potawatomi | 74.3 /100 | #151 | Good 92.8% |
| Iraqis | 74.2 /100 | #152 | Good 92.8% |
| Brazilians | 73.9 /100 | #153 | Good 92.8% |
| Osage | 73.4 /100 | #154 | Good 92.7% |
| Argentineans | 73.4 /100 | #155 | Good 92.7% |
| Immigrants | Spain | 73.0 /100 | #156 | Good 92.7% |
| Immigrants | Eastern Asia | 72.6 /100 | #157 | Good 92.7% |
| Immigrants | Venezuela | 72.0 /100 | #158 | Good 92.7% |
| Americans | 71.7 /100 | #159 | Good 92.7% |
| Immigrants | Lebanon | 70.7 /100 | #160 | Good 92.7% |
| Immigrants | Argentina | 69.8 /100 | #161 | Good 92.7% |
| Paraguayans | 68.7 /100 | #162 | Good 92.7% |
| Immigrants | Nonimmigrants | 66.6 /100 | #163 | Good 92.7% |