Immigrants from Grenada vs Tohono O'odham 11th Grade
COMPARE
Immigrants from Grenada
Tohono O'odham
11th Grade
11th Grade Comparison
Immigrants from Grenada
Tohono O'odham
90.1%
11TH GRADE
0.0/ 100
METRIC RATING
294th/ 347
METRIC RANK
87.6%
11TH GRADE
0.0/ 100
METRIC RATING
328th/ 347
METRIC RANK
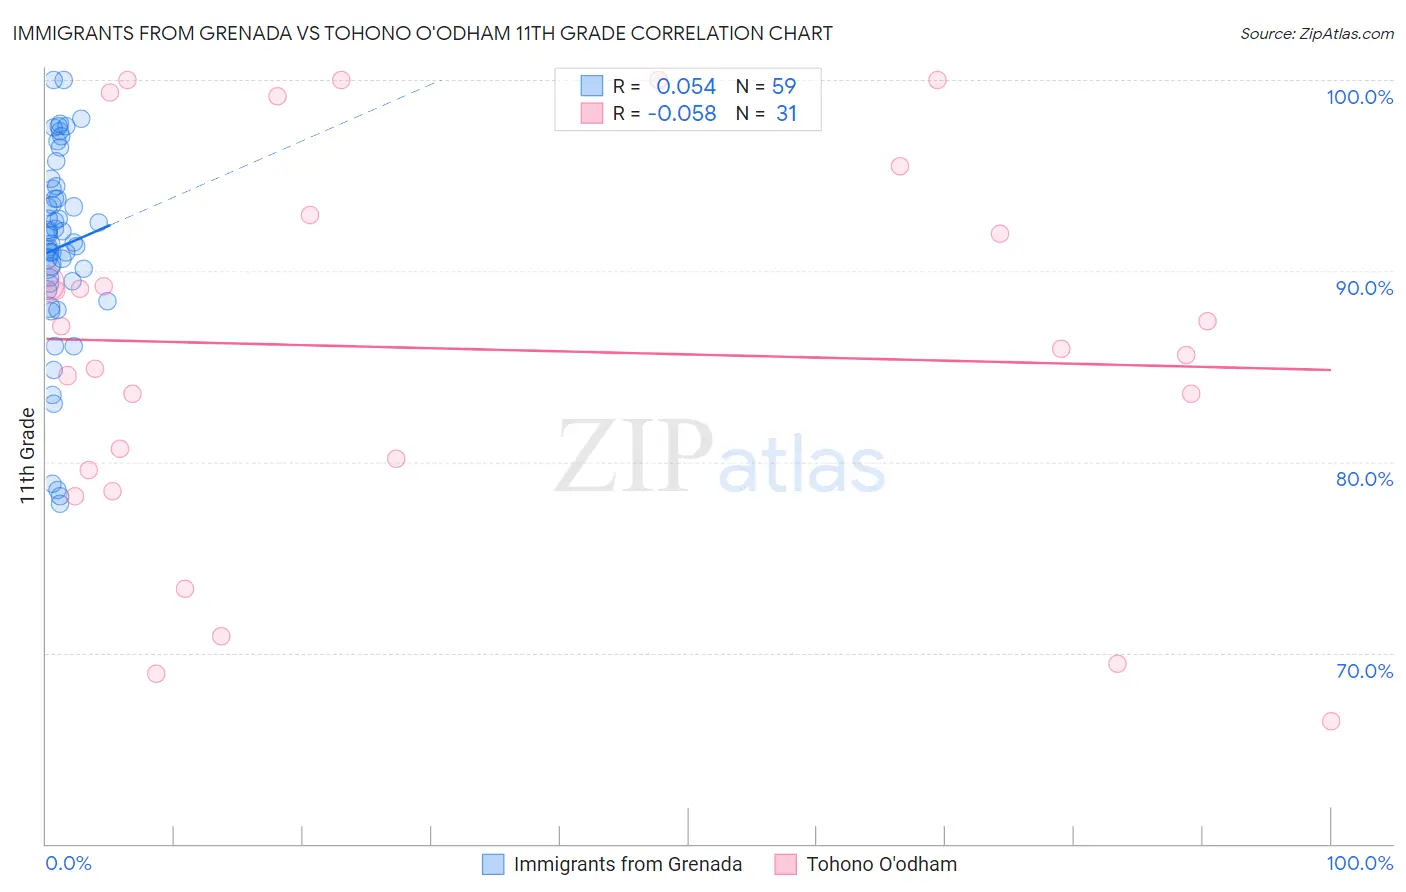
Immigrants from Grenada vs Tohono O'odham 11th Grade Correlation Chart
The statistical analysis conducted on geographies consisting of 67,201,908 people shows a slight positive correlation between the proportion of Immigrants from Grenada and percentage of population with at least 11th grade education in the United States with a correlation coefficient (R) of 0.054 and weighted average of 90.1%. Similarly, the statistical analysis conducted on geographies consisting of 58,730,615 people shows a slight negative correlation between the proportion of Tohono O'odham and percentage of population with at least 11th grade education in the United States with a correlation coefficient (R) of -0.058 and weighted average of 87.6%, a difference of 2.9%.
11th Grade Correlation Summary
| Measurement | Immigrants from Grenada | Tohono O'odham |
| Minimum | 77.8% | 66.4% |
| Maximum | 100.0% | 100.0% |
| Range | 22.2% | 33.6% |
| Mean | 91.2% | 85.9% |
| Median | 91.5% | 86.0% |
| Interquartile 25% (IQ1) | 89.4% | 79.6% |
| Interquartile 75% (IQ3) | 94.3% | 93.0% |
| Interquartile Range (IQR) | 5.0% | 13.4% |
| Standard Deviation (Sample) | 5.1% | 9.9% |
| Standard Deviation (Population) | 5.1% | 9.7% |
Similar Demographics by 11th Grade
Demographics Similar to Immigrants from Grenada by 11th Grade
In terms of 11th grade, the demographic groups most similar to Immigrants from Grenada are Native/Alaskan (90.2%, a difference of 0.050%), Immigrants from Vietnam (90.0%, a difference of 0.11%), Cuban (90.2%, a difference of 0.12%), Fijian (90.0%, a difference of 0.12%), and Haitian (90.3%, a difference of 0.14%).
| Demographics | Rating | Rank | 11th Grade |
| Apache | 0.0 /100 | #287 | Tragic 90.4% |
| Pennsylvania Germans | 0.0 /100 | #288 | Tragic 90.3% |
| British West Indians | 0.0 /100 | #289 | Tragic 90.3% |
| Indonesians | 0.0 /100 | #290 | Tragic 90.3% |
| Haitians | 0.0 /100 | #291 | Tragic 90.3% |
| Cubans | 0.0 /100 | #292 | Tragic 90.2% |
| Natives/Alaskans | 0.0 /100 | #293 | Tragic 90.2% |
| Immigrants | Grenada | 0.0 /100 | #294 | Tragic 90.1% |
| Immigrants | Vietnam | 0.0 /100 | #295 | Tragic 90.0% |
| Fijians | 0.0 /100 | #296 | Tragic 90.0% |
| Navajo | 0.0 /100 | #297 | Tragic 90.0% |
| Immigrants | Fiji | 0.0 /100 | #298 | Tragic 89.9% |
| Japanese | 0.0 /100 | #299 | Tragic 89.9% |
| Immigrants | Haiti | 0.0 /100 | #300 | Tragic 89.9% |
| Guyanese | 0.0 /100 | #301 | Tragic 89.9% |
Demographics Similar to Tohono O'odham by 11th Grade
In terms of 11th grade, the demographic groups most similar to Tohono O'odham are Immigrants from Cabo Verde (87.6%, a difference of 0.060%), Mexican American Indian (87.5%, a difference of 0.070%), Dominican (87.7%, a difference of 0.080%), Honduran (87.4%, a difference of 0.26%), and Hispanic or Latino (87.3%, a difference of 0.32%).
| Demographics | Rating | Rank | 11th Grade |
| Immigrants | Belize | 0.0 /100 | #321 | Tragic 88.7% |
| Puerto Ricans | 0.0 /100 | #322 | Tragic 88.4% |
| Pima | 0.0 /100 | #323 | Tragic 88.3% |
| Central American Indians | 0.0 /100 | #324 | Tragic 88.2% |
| Immigrants | Nicaragua | 0.0 /100 | #325 | Tragic 88.1% |
| Dominicans | 0.0 /100 | #326 | Tragic 87.7% |
| Immigrants | Cabo Verde | 0.0 /100 | #327 | Tragic 87.6% |
| Tohono O'odham | 0.0 /100 | #328 | Tragic 87.6% |
| Mexican American Indians | 0.0 /100 | #329 | Tragic 87.5% |
| Hondurans | 0.0 /100 | #330 | Tragic 87.4% |
| Hispanics or Latinos | 0.0 /100 | #331 | Tragic 87.3% |
| Immigrants | Azores | 0.0 /100 | #332 | Tragic 87.2% |
| Immigrants | Yemen | 0.0 /100 | #333 | Tragic 87.1% |
| Houma | 0.0 /100 | #334 | Tragic 87.0% |
| Central Americans | 0.0 /100 | #335 | Tragic 86.9% |