Immigrants from Ghana vs Immigrants from Panama College, 1 year or more
COMPARE
Immigrants from Ghana
Immigrants from Panama
College, 1 year or more
College, 1 year or more Comparison
Immigrants from Ghana
Immigrants from Panama
57.4%
COLLEGE, 1 YEAR OR MORE
7.7/ 100
METRIC RATING
221st/ 347
METRIC RANK
57.6%
COLLEGE, 1 YEAR OR MORE
9.1/ 100
METRIC RATING
217th/ 347
METRIC RANK
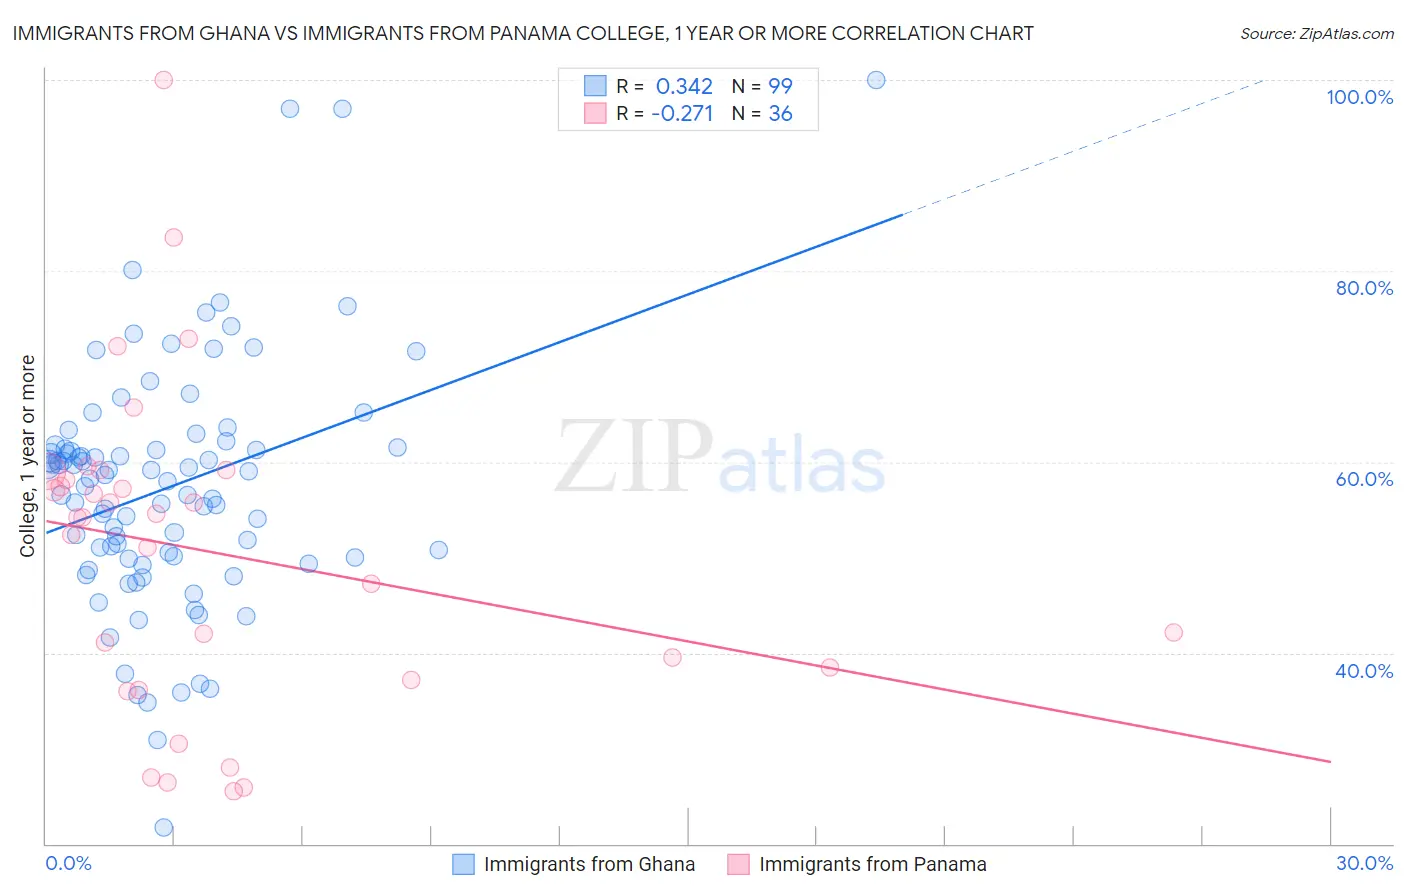
Immigrants from Ghana vs Immigrants from Panama College, 1 year or more Correlation Chart
The statistical analysis conducted on geographies consisting of 199,951,982 people shows a mild positive correlation between the proportion of Immigrants from Ghana and percentage of population with at least college, 1 year or more education in the United States with a correlation coefficient (R) of 0.342 and weighted average of 57.4%. Similarly, the statistical analysis conducted on geographies consisting of 221,184,524 people shows a weak negative correlation between the proportion of Immigrants from Panama and percentage of population with at least college, 1 year or more education in the United States with a correlation coefficient (R) of -0.271 and weighted average of 57.6%, a difference of 0.25%.
College, 1 year or more Correlation Summary
| Measurement | Immigrants from Ghana | Immigrants from Panama |
| Minimum | 21.7% | 25.5% |
| Maximum | 100.0% | 100.0% |
| Range | 78.3% | 74.5% |
| Mean | 57.3% | 50.5% |
| Median | 58.2% | 54.2% |
| Interquartile 25% (IQ1) | 50.0% | 37.8% |
| Interquartile 75% (IQ3) | 61.5% | 58.5% |
| Interquartile Range (IQR) | 11.5% | 20.7% |
| Standard Deviation (Sample) | 12.8% | 16.7% |
| Standard Deviation (Population) | 12.7% | 16.5% |
Demographics Similar to Immigrants from Ghana and Immigrants from Panama by College, 1 year or more
In terms of college, 1 year or more, the demographic groups most similar to Immigrants from Ghana are Immigrants from Costa Rica (57.5%, a difference of 0.070%), White/Caucasian (57.6%, a difference of 0.19%), Native Hawaiian (57.6%, a difference of 0.25%), Subsaharan African (57.3%, a difference of 0.34%), and Immigrants from Peru (57.7%, a difference of 0.49%). Similarly, the demographic groups most similar to Immigrants from Panama are Native Hawaiian (57.6%, a difference of 0.0%), White/Caucasian (57.6%, a difference of 0.070%), Immigrants from Costa Rica (57.5%, a difference of 0.19%), Immigrants from Peru (57.7%, a difference of 0.24%), and Immigrants from Colombia (57.8%, a difference of 0.37%).
| Demographics | Rating | Rank | College, 1 year or more |
| Immigrants | Middle Africa | 14.0 /100 | #209 | Poor 58.0% |
| Tsimshian | 13.5 /100 | #210 | Poor 57.9% |
| Immigrants | Nigeria | 13.3 /100 | #211 | Poor 57.9% |
| Immigrants | Senegal | 11.8 /100 | #212 | Poor 57.8% |
| French Canadians | 11.8 /100 | #213 | Poor 57.8% |
| Immigrants | Colombia | 11.6 /100 | #214 | Poor 57.8% |
| Tongans | 11.6 /100 | #215 | Poor 57.8% |
| Immigrants | Peru | 10.6 /100 | #216 | Poor 57.7% |
| Immigrants | Panama | 9.1 /100 | #217 | Tragic 57.6% |
| Native Hawaiians | 9.0 /100 | #218 | Tragic 57.6% |
| Whites/Caucasians | 8.7 /100 | #219 | Tragic 57.6% |
| Immigrants | Costa Rica | 8.0 /100 | #220 | Tragic 57.5% |
| Immigrants | Ghana | 7.7 /100 | #221 | Tragic 57.4% |
| Sub-Saharan Africans | 6.1 /100 | #222 | Tragic 57.3% |
| Portuguese | 5.4 /100 | #223 | Tragic 57.2% |
| Hmong | 5.4 /100 | #224 | Tragic 57.2% |
| Vietnamese | 4.7 /100 | #225 | Tragic 57.0% |
| Immigrants | Western Africa | 4.6 /100 | #226 | Tragic 57.0% |
| Immigrants | Immigrants | 4.4 /100 | #227 | Tragic 57.0% |
| Immigrants | Fiji | 4.0 /100 | #228 | Tragic 56.9% |
| Cree | 3.6 /100 | #229 | Tragic 56.8% |