Swedish vs Immigrants from Panama College, 1 year or more
COMPARE
Swedish
Immigrants from Panama
College, 1 year or more
College, 1 year or more Comparison
Swedes
Immigrants from Panama
62.1%
COLLEGE, 1 YEAR OR MORE
96.8/ 100
METRIC RATING
101st/ 347
METRIC RANK
57.6%
COLLEGE, 1 YEAR OR MORE
9.1/ 100
METRIC RATING
217th/ 347
METRIC RANK
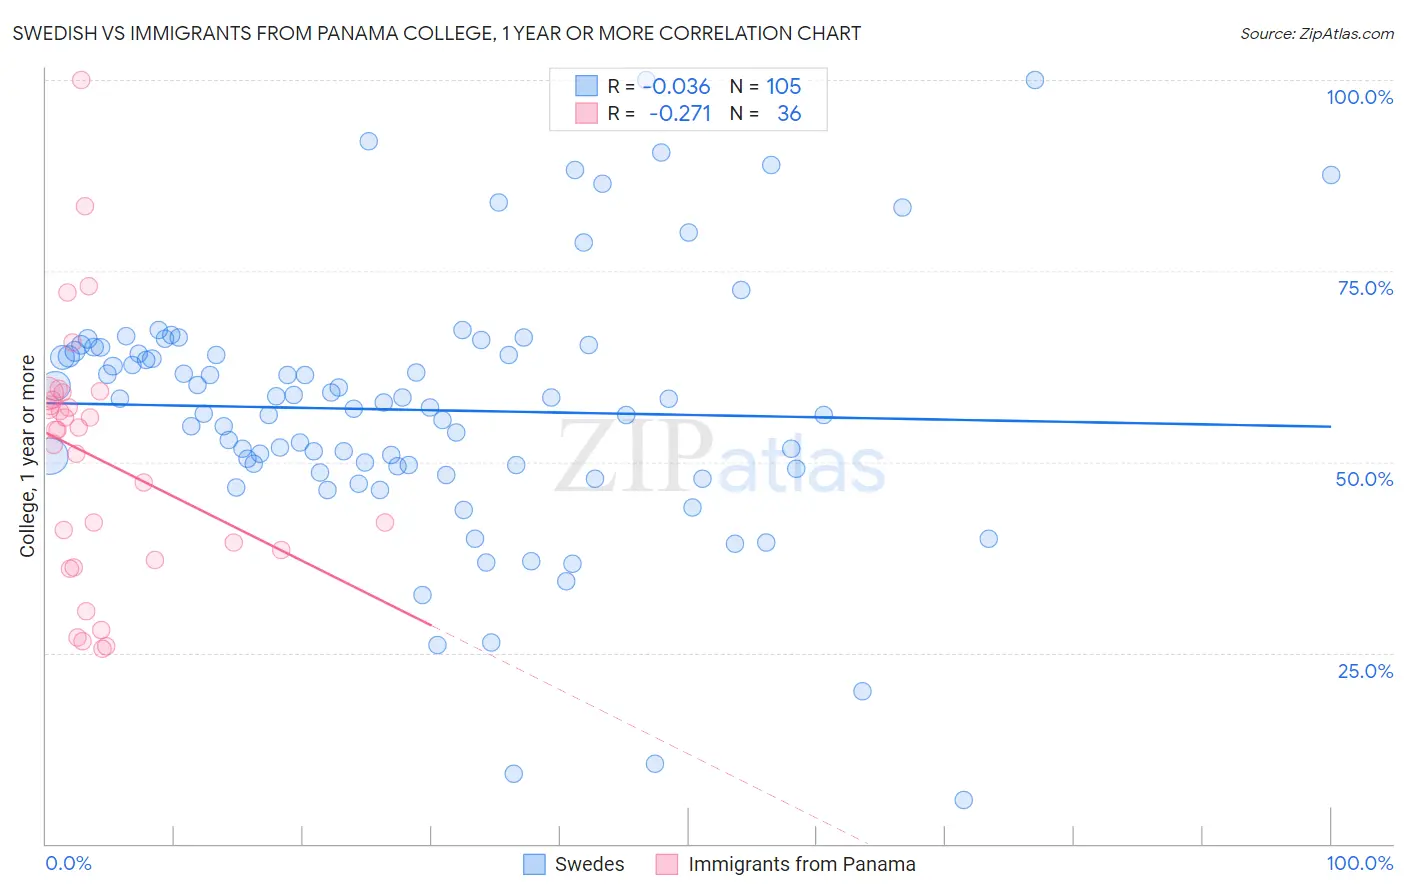
Swedish vs Immigrants from Panama College, 1 year or more Correlation Chart
The statistical analysis conducted on geographies consisting of 539,224,370 people shows no correlation between the proportion of Swedes and percentage of population with at least college, 1 year or more education in the United States with a correlation coefficient (R) of -0.036 and weighted average of 62.1%. Similarly, the statistical analysis conducted on geographies consisting of 221,184,524 people shows a weak negative correlation between the proportion of Immigrants from Panama and percentage of population with at least college, 1 year or more education in the United States with a correlation coefficient (R) of -0.271 and weighted average of 57.6%, a difference of 7.8%.
College, 1 year or more Correlation Summary
| Measurement | Swedish | Immigrants from Panama |
| Minimum | 5.7% | 25.5% |
| Maximum | 100.0% | 100.0% |
| Range | 94.3% | 74.5% |
| Mean | 56.8% | 50.5% |
| Median | 57.8% | 54.2% |
| Interquartile 25% (IQ1) | 49.2% | 37.8% |
| Interquartile 75% (IQ3) | 64.7% | 58.5% |
| Interquartile Range (IQR) | 15.5% | 20.7% |
| Standard Deviation (Sample) | 16.9% | 16.7% |
| Standard Deviation (Population) | 16.9% | 16.5% |
Similar Demographics by College, 1 year or more
Demographics Similar to Swedes by College, 1 year or more
In terms of college, 1 year or more, the demographic groups most similar to Swedes are Icelander (62.1%, a difference of 0.0%), Luxembourger (62.1%, a difference of 0.020%), Afghan (62.0%, a difference of 0.13%), Chilean (62.0%, a difference of 0.14%), and Immigrants from Nepal (62.0%, a difference of 0.16%).
| Demographics | Rating | Rank | College, 1 year or more |
| Immigrants | Croatia | 97.6 /100 | #94 | Exceptional 62.3% |
| British | 97.4 /100 | #95 | Exceptional 62.3% |
| Chinese | 97.2 /100 | #96 | Exceptional 62.2% |
| Jordanians | 97.2 /100 | #97 | Exceptional 62.2% |
| Carpatho Rusyns | 97.2 /100 | #98 | Exceptional 62.2% |
| Croatians | 97.1 /100 | #99 | Exceptional 62.2% |
| Icelanders | 96.8 /100 | #100 | Exceptional 62.1% |
| Swedes | 96.8 /100 | #101 | Exceptional 62.1% |
| Luxembourgers | 96.7 /100 | #102 | Exceptional 62.1% |
| Afghans | 96.4 /100 | #103 | Exceptional 62.0% |
| Chileans | 96.4 /100 | #104 | Exceptional 62.0% |
| Immigrants | Nepal | 96.3 /100 | #105 | Exceptional 62.0% |
| Palestinians | 96.3 /100 | #106 | Exceptional 62.0% |
| Immigrants | Ukraine | 95.8 /100 | #107 | Exceptional 61.9% |
| Syrians | 95.7 /100 | #108 | Exceptional 61.9% |
Demographics Similar to Immigrants from Panama by College, 1 year or more
In terms of college, 1 year or more, the demographic groups most similar to Immigrants from Panama are Native Hawaiian (57.6%, a difference of 0.0%), White/Caucasian (57.6%, a difference of 0.070%), Immigrants from Costa Rica (57.5%, a difference of 0.19%), Immigrants from Peru (57.7%, a difference of 0.24%), and Immigrants from Ghana (57.4%, a difference of 0.25%).
| Demographics | Rating | Rank | College, 1 year or more |
| Tsimshian | 13.5 /100 | #210 | Poor 57.9% |
| Immigrants | Nigeria | 13.3 /100 | #211 | Poor 57.9% |
| Immigrants | Senegal | 11.8 /100 | #212 | Poor 57.8% |
| French Canadians | 11.8 /100 | #213 | Poor 57.8% |
| Immigrants | Colombia | 11.6 /100 | #214 | Poor 57.8% |
| Tongans | 11.6 /100 | #215 | Poor 57.8% |
| Immigrants | Peru | 10.6 /100 | #216 | Poor 57.7% |
| Immigrants | Panama | 9.1 /100 | #217 | Tragic 57.6% |
| Native Hawaiians | 9.0 /100 | #218 | Tragic 57.6% |
| Whites/Caucasians | 8.7 /100 | #219 | Tragic 57.6% |
| Immigrants | Costa Rica | 8.0 /100 | #220 | Tragic 57.5% |
| Immigrants | Ghana | 7.7 /100 | #221 | Tragic 57.4% |
| Sub-Saharan Africans | 6.1 /100 | #222 | Tragic 57.3% |
| Portuguese | 5.4 /100 | #223 | Tragic 57.2% |
| Hmong | 5.4 /100 | #224 | Tragic 57.2% |