Immigrants from Ghana vs Immigrants from Panama Median Male Earnings
COMPARE
Immigrants from Ghana
Immigrants from Panama
Median Male Earnings
Median Male Earnings Comparison
Immigrants from Ghana
Immigrants from Panama
$51,836
MEDIAN MALE EARNINGS
6.9/ 100
METRIC RATING
219th/ 347
METRIC RANK
$51,962
MEDIAN MALE EARNINGS
7.7/ 100
METRIC RATING
218th/ 347
METRIC RANK
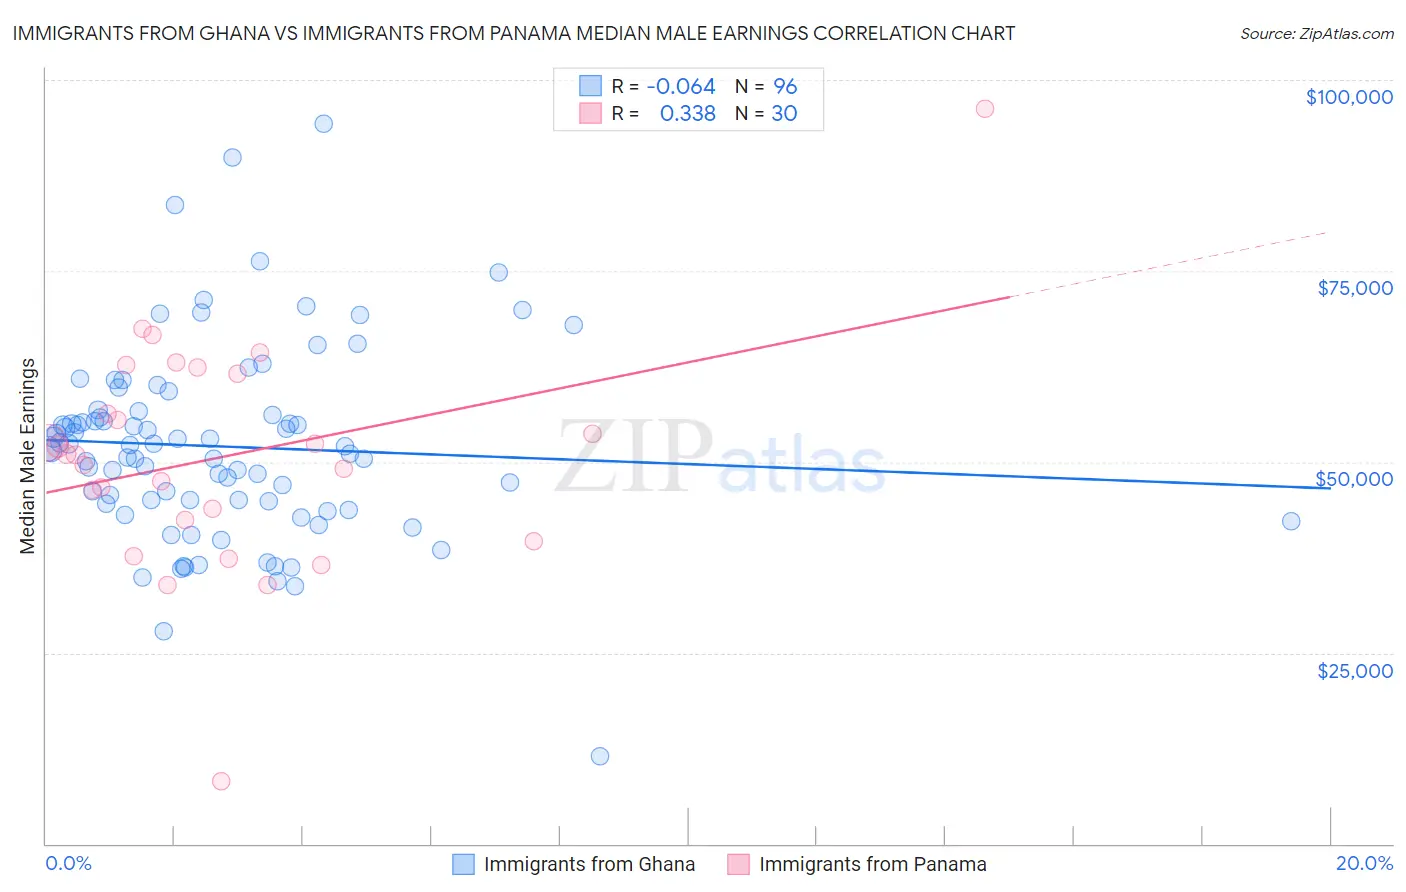
Immigrants from Ghana vs Immigrants from Panama Median Male Earnings Correlation Chart
The statistical analysis conducted on geographies consisting of 199,928,244 people shows a slight negative correlation between the proportion of Immigrants from Ghana and median male earnings in the United States with a correlation coefficient (R) of -0.064 and weighted average of $51,836. Similarly, the statistical analysis conducted on geographies consisting of 221,157,790 people shows a mild positive correlation between the proportion of Immigrants from Panama and median male earnings in the United States with a correlation coefficient (R) of 0.338 and weighted average of $51,962, a difference of 0.24%.
Median Male Earnings Correlation Summary
| Measurement | Immigrants from Ghana | Immigrants from Panama |
| Minimum | $11,405 | $8,214 |
| Maximum | $94,205 | $96,250 |
| Range | $82,800 | $88,036 |
| Mean | $52,017 | $50,691 |
| Median | $51,835 | $50,981 |
| Interquartile 25% (IQ1) | $44,651 | $42,361 |
| Interquartile 75% (IQ3) | $56,389 | $61,515 |
| Interquartile Range (IQR) | $11,739 | $19,154 |
| Standard Deviation (Sample) | $12,685 | $15,111 |
| Standard Deviation (Population) | $12,619 | $14,857 |
Demographics Similar to Immigrants from Ghana and Immigrants from Panama by Median Male Earnings
In terms of median male earnings, the demographic groups most similar to Immigrants from Ghana are Immigrants from Armenia ($51,793, a difference of 0.080%), Immigrants from Senegal ($51,647, a difference of 0.37%), Immigrants from Bangladesh ($51,642, a difference of 0.38%), Nigerian ($52,039, a difference of 0.39%), and Immigrants from Venezuela ($52,041, a difference of 0.40%). Similarly, the demographic groups most similar to Immigrants from Panama are Immigrants from Venezuela ($52,041, a difference of 0.15%), Nigerian ($52,039, a difference of 0.15%), Immigrants from Cameroon ($52,119, a difference of 0.30%), Immigrants from Armenia ($51,793, a difference of 0.33%), and Nonimmigrants ($52,170, a difference of 0.40%).
| Demographics | Rating | Rank | Median Male Earnings |
| Venezuelans | 12.5 /100 | #208 | Poor $52,510 |
| Bermudans | 12.1 /100 | #209 | Poor $52,465 |
| Delaware | 11.5 /100 | #210 | Poor $52,412 |
| Tlingit-Haida | 11.5 /100 | #211 | Poor $52,409 |
| Cajuns | 10.7 /100 | #212 | Poor $52,325 |
| Native Hawaiians | 10.5 /100 | #213 | Poor $52,306 |
| Immigrants | Nonimmigrants | 9.3 /100 | #214 | Tragic $52,170 |
| Immigrants | Cameroon | 8.9 /100 | #215 | Tragic $52,119 |
| Immigrants | Venezuela | 8.3 /100 | #216 | Tragic $52,041 |
| Nigerians | 8.3 /100 | #217 | Tragic $52,039 |
| Immigrants | Panama | 7.7 /100 | #218 | Tragic $51,962 |
| Immigrants | Ghana | 6.9 /100 | #219 | Tragic $51,836 |
| Immigrants | Armenia | 6.6 /100 | #220 | Tragic $51,793 |
| Immigrants | Senegal | 5.8 /100 | #221 | Tragic $51,647 |
| Immigrants | Bangladesh | 5.8 /100 | #222 | Tragic $51,642 |
| Ecuadorians | 5.5 /100 | #223 | Tragic $51,596 |
| Immigrants | Cambodia | 5.5 /100 | #224 | Tragic $51,594 |
| Immigrants | Sudan | 5.0 /100 | #225 | Tragic $51,489 |
| Japanese | 4.9 /100 | #226 | Tragic $51,473 |
| Trinidadians and Tobagonians | 4.8 /100 | #227 | Tragic $51,446 |
| Samoans | 4.6 /100 | #228 | Tragic $51,389 |