Immigrants from Ghana vs Immigrants from Panama Self-Care Disability
COMPARE
Immigrants from Ghana
Immigrants from Panama
Self-Care Disability
Self-Care Disability Comparison
Immigrants from Ghana
Immigrants from Panama
2.5%
SELF-CARE DISABILITY
14.7/ 100
METRIC RATING
199th/ 347
METRIC RANK
2.6%
SELF-CARE DISABILITY
1.2/ 100
METRIC RATING
239th/ 347
METRIC RANK
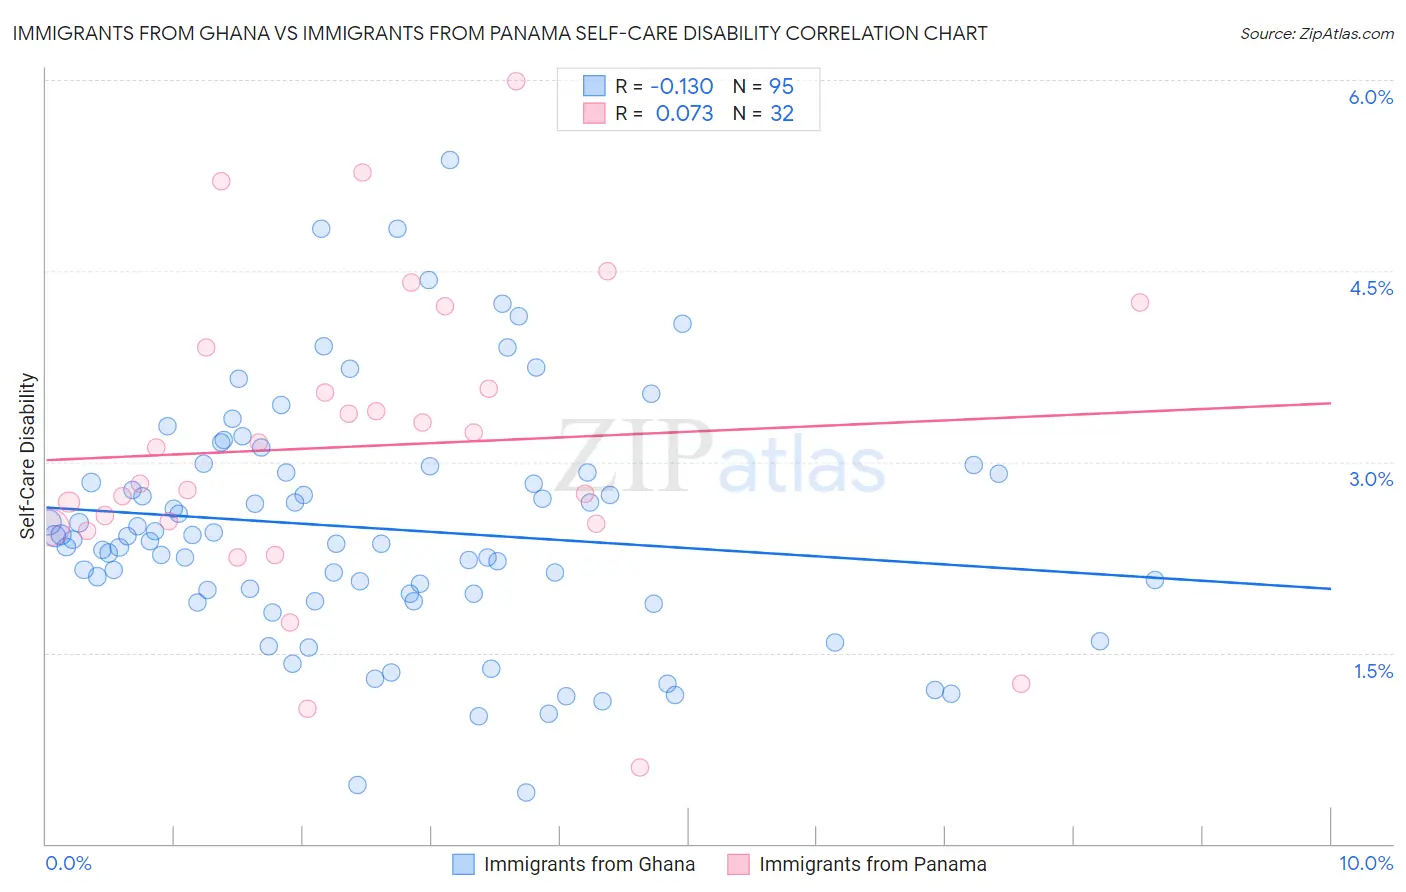
Immigrants from Ghana vs Immigrants from Panama Self-Care Disability Correlation Chart
The statistical analysis conducted on geographies consisting of 199,790,257 people shows a poor negative correlation between the proportion of Immigrants from Ghana and percentage of population with self-care disability in the United States with a correlation coefficient (R) of -0.130 and weighted average of 2.5%. Similarly, the statistical analysis conducted on geographies consisting of 221,140,353 people shows a slight positive correlation between the proportion of Immigrants from Panama and percentage of population with self-care disability in the United States with a correlation coefficient (R) of 0.073 and weighted average of 2.6%, a difference of 3.1%.
Self-Care Disability Correlation Summary
| Measurement | Immigrants from Ghana | Immigrants from Panama |
| Minimum | 0.40% | 0.60% |
| Maximum | 5.4% | 6.0% |
| Range | 5.0% | 5.4% |
| Mean | 2.5% | 3.1% |
| Median | 2.4% | 3.0% |
| Interquartile 25% (IQ1) | 2.0% | 2.5% |
| Interquartile 75% (IQ3) | 2.9% | 3.7% |
| Interquartile Range (IQR) | 0.96% | 1.2% |
| Standard Deviation (Sample) | 0.94% | 1.2% |
| Standard Deviation (Population) | 0.94% | 1.2% |
Similar Demographics by Self-Care Disability
Demographics Similar to Immigrants from Ghana by Self-Care Disability
In terms of self-care disability, the demographic groups most similar to Immigrants from Ghana are Immigrants (2.5%, a difference of 0.020%), Crow (2.5%, a difference of 0.050%), Korean (2.5%, a difference of 0.070%), Immigrants from Southern Europe (2.5%, a difference of 0.080%), and Immigrants from Western Africa (2.5%, a difference of 0.14%).
| Demographics | Rating | Rank | Self-Care Disability |
| Soviet Union | 22.2 /100 | #192 | Fair 2.5% |
| Ukrainians | 21.4 /100 | #193 | Fair 2.5% |
| Immigrants | Germany | 17.9 /100 | #194 | Poor 2.5% |
| Immigrants | Southern Europe | 15.6 /100 | #195 | Poor 2.5% |
| Koreans | 15.5 /100 | #196 | Poor 2.5% |
| Crow | 15.2 /100 | #197 | Poor 2.5% |
| Immigrants | Immigrants | 15.0 /100 | #198 | Poor 2.5% |
| Immigrants | Ghana | 14.7 /100 | #199 | Poor 2.5% |
| Immigrants | Western Africa | 13.3 /100 | #200 | Poor 2.5% |
| Immigrants | South Eastern Asia | 12.9 /100 | #201 | Poor 2.5% |
| Slovaks | 12.6 /100 | #202 | Poor 2.5% |
| Immigrants | Lebanon | 12.4 /100 | #203 | Poor 2.5% |
| Immigrants | Bahamas | 11.9 /100 | #204 | Poor 2.5% |
| Immigrants | Russia | 11.0 /100 | #205 | Poor 2.5% |
| Alaskan Athabascans | 10.4 /100 | #206 | Poor 2.5% |
Demographics Similar to Immigrants from Panama by Self-Care Disability
In terms of self-care disability, the demographic groups most similar to Immigrants from Panama are Marshallese (2.6%, a difference of 0.030%), Senegalese (2.6%, a difference of 0.040%), Immigrants from Syria (2.6%, a difference of 0.20%), Immigrants from Senegal (2.6%, a difference of 0.31%), and Spanish (2.6%, a difference of 0.43%).
| Demographics | Rating | Rank | Self-Care Disability |
| Albanians | 2.2 /100 | #232 | Tragic 2.6% |
| Liberians | 2.1 /100 | #233 | Tragic 2.6% |
| Vietnamese | 2.1 /100 | #234 | Tragic 2.6% |
| Bahamians | 2.0 /100 | #235 | Tragic 2.6% |
| Bermudans | 1.9 /100 | #236 | Tragic 2.6% |
| Immigrants | Senegal | 1.6 /100 | #237 | Tragic 2.6% |
| Senegalese | 1.3 /100 | #238 | Tragic 2.6% |
| Immigrants | Panama | 1.2 /100 | #239 | Tragic 2.6% |
| Marshallese | 1.2 /100 | #240 | Tragic 2.6% |
| Immigrants | Syria | 1.0 /100 | #241 | Tragic 2.6% |
| Spanish | 0.8 /100 | #242 | Tragic 2.6% |
| Hawaiians | 0.8 /100 | #243 | Tragic 2.6% |
| Yuman | 0.8 /100 | #244 | Tragic 2.6% |
| Immigrants | Western Asia | 0.6 /100 | #245 | Tragic 2.6% |
| Cheyenne | 0.6 /100 | #246 | Tragic 2.6% |