Immigrants from Dominica vs Immigrants from Panama College, 1 year or more
COMPARE
Immigrants from Dominica
Immigrants from Panama
College, 1 year or more
College, 1 year or more Comparison
Immigrants from Dominica
Immigrants from Panama
52.5%
COLLEGE, 1 YEAR OR MORE
0.0/ 100
METRIC RATING
298th/ 347
METRIC RANK
57.6%
COLLEGE, 1 YEAR OR MORE
9.1/ 100
METRIC RATING
217th/ 347
METRIC RANK
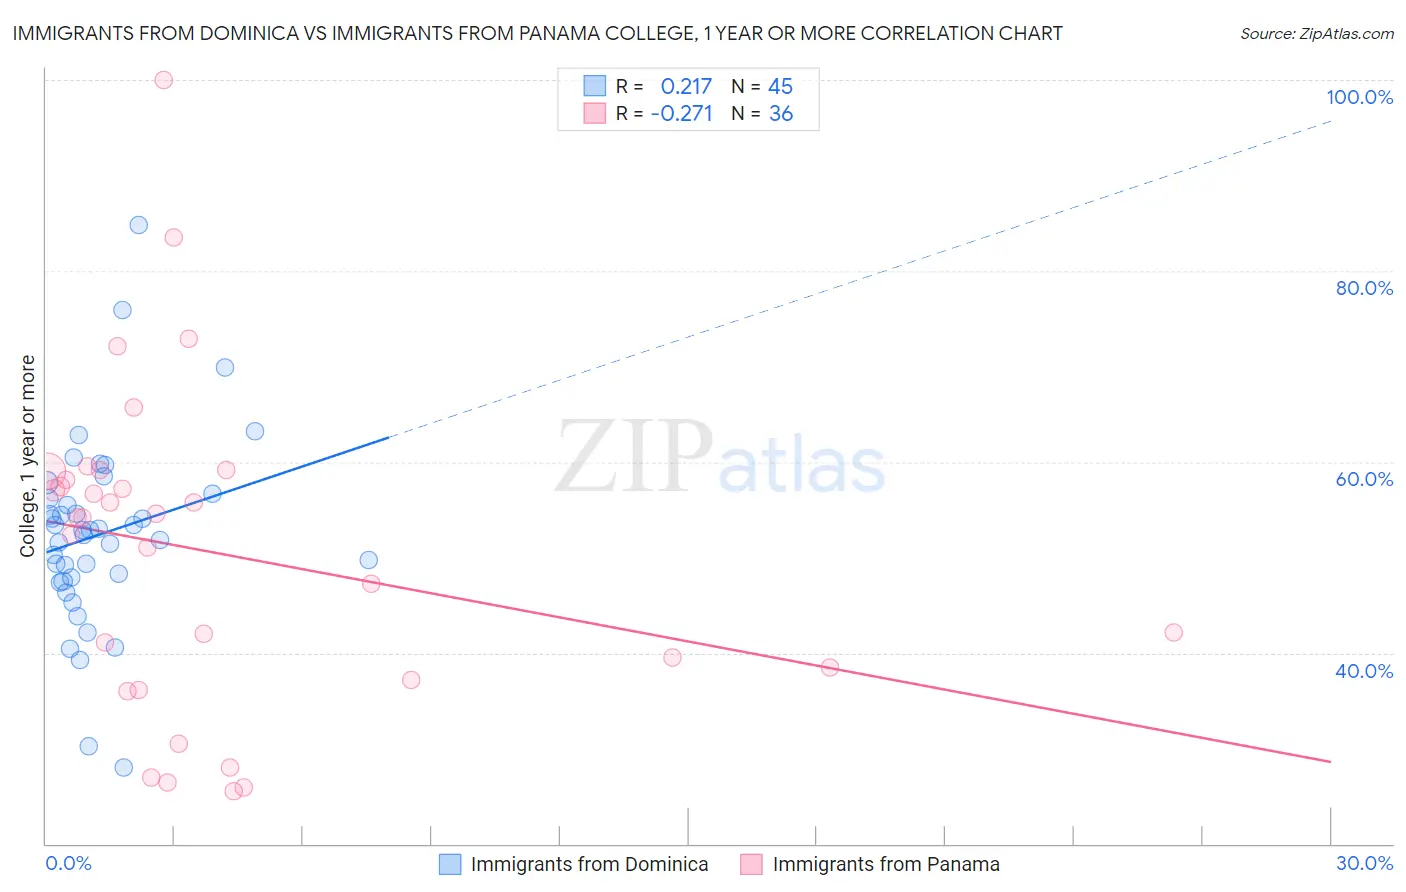
Immigrants from Dominica vs Immigrants from Panama College, 1 year or more Correlation Chart
The statistical analysis conducted on geographies consisting of 83,795,636 people shows a weak positive correlation between the proportion of Immigrants from Dominica and percentage of population with at least college, 1 year or more education in the United States with a correlation coefficient (R) of 0.217 and weighted average of 52.5%. Similarly, the statistical analysis conducted on geographies consisting of 221,184,524 people shows a weak negative correlation between the proportion of Immigrants from Panama and percentage of population with at least college, 1 year or more education in the United States with a correlation coefficient (R) of -0.271 and weighted average of 57.6%, a difference of 9.6%.
College, 1 year or more Correlation Summary
| Measurement | Immigrants from Dominica | Immigrants from Panama |
| Minimum | 28.1% | 25.5% |
| Maximum | 84.8% | 100.0% |
| Range | 56.7% | 74.5% |
| Mean | 52.4% | 50.5% |
| Median | 52.8% | 54.2% |
| Interquartile 25% (IQ1) | 47.7% | 37.8% |
| Interquartile 75% (IQ3) | 56.4% | 58.5% |
| Interquartile Range (IQR) | 8.7% | 20.7% |
| Standard Deviation (Sample) | 10.0% | 16.7% |
| Standard Deviation (Population) | 9.9% | 16.5% |
Similar Demographics by College, 1 year or more
Demographics Similar to Immigrants from Dominica by College, 1 year or more
In terms of college, 1 year or more, the demographic groups most similar to Immigrants from Dominica are Immigrants from Nicaragua (52.4%, a difference of 0.34%), Choctaw (52.3%, a difference of 0.38%), Haitian (52.3%, a difference of 0.44%), Puerto Rican (52.2%, a difference of 0.57%), and Paiute (52.9%, a difference of 0.59%).
| Demographics | Rating | Rank | College, 1 year or more |
| Cubans | 0.0 /100 | #291 | Tragic 53.4% |
| Chickasaw | 0.0 /100 | #292 | Tragic 53.3% |
| Blacks/African Americans | 0.0 /100 | #293 | Tragic 53.3% |
| Cherokee | 0.0 /100 | #294 | Tragic 53.2% |
| Yaqui | 0.0 /100 | #295 | Tragic 53.2% |
| Sioux | 0.0 /100 | #296 | Tragic 53.0% |
| Paiute | 0.0 /100 | #297 | Tragic 52.9% |
| Immigrants | Dominica | 0.0 /100 | #298 | Tragic 52.5% |
| Immigrants | Nicaragua | 0.0 /100 | #299 | Tragic 52.4% |
| Choctaw | 0.0 /100 | #300 | Tragic 52.3% |
| Haitians | 0.0 /100 | #301 | Tragic 52.3% |
| Puerto Ricans | 0.0 /100 | #302 | Tragic 52.2% |
| Creek | 0.0 /100 | #303 | Tragic 52.2% |
| Central Americans | 0.0 /100 | #304 | Tragic 52.1% |
| Seminole | 0.0 /100 | #305 | Tragic 52.1% |
Demographics Similar to Immigrants from Panama by College, 1 year or more
In terms of college, 1 year or more, the demographic groups most similar to Immigrants from Panama are Native Hawaiian (57.6%, a difference of 0.0%), White/Caucasian (57.6%, a difference of 0.070%), Immigrants from Costa Rica (57.5%, a difference of 0.19%), Immigrants from Peru (57.7%, a difference of 0.24%), and Immigrants from Ghana (57.4%, a difference of 0.25%).
| Demographics | Rating | Rank | College, 1 year or more |
| Tsimshian | 13.5 /100 | #210 | Poor 57.9% |
| Immigrants | Nigeria | 13.3 /100 | #211 | Poor 57.9% |
| Immigrants | Senegal | 11.8 /100 | #212 | Poor 57.8% |
| French Canadians | 11.8 /100 | #213 | Poor 57.8% |
| Immigrants | Colombia | 11.6 /100 | #214 | Poor 57.8% |
| Tongans | 11.6 /100 | #215 | Poor 57.8% |
| Immigrants | Peru | 10.6 /100 | #216 | Poor 57.7% |
| Immigrants | Panama | 9.1 /100 | #217 | Tragic 57.6% |
| Native Hawaiians | 9.0 /100 | #218 | Tragic 57.6% |
| Whites/Caucasians | 8.7 /100 | #219 | Tragic 57.6% |
| Immigrants | Costa Rica | 8.0 /100 | #220 | Tragic 57.5% |
| Immigrants | Ghana | 7.7 /100 | #221 | Tragic 57.4% |
| Sub-Saharan Africans | 6.1 /100 | #222 | Tragic 57.3% |
| Portuguese | 5.4 /100 | #223 | Tragic 57.2% |
| Hmong | 5.4 /100 | #224 | Tragic 57.2% |