Immigrants from Ghana vs Lebanese College, 1 year or more
COMPARE
Immigrants from Ghana
Lebanese
College, 1 year or more
College, 1 year or more Comparison
Immigrants from Ghana
Lebanese
57.4%
COLLEGE, 1 YEAR OR MORE
7.7/ 100
METRIC RATING
221st/ 347
METRIC RANK
61.6%
COLLEGE, 1 YEAR OR MORE
94.1/ 100
METRIC RATING
116th/ 347
METRIC RANK
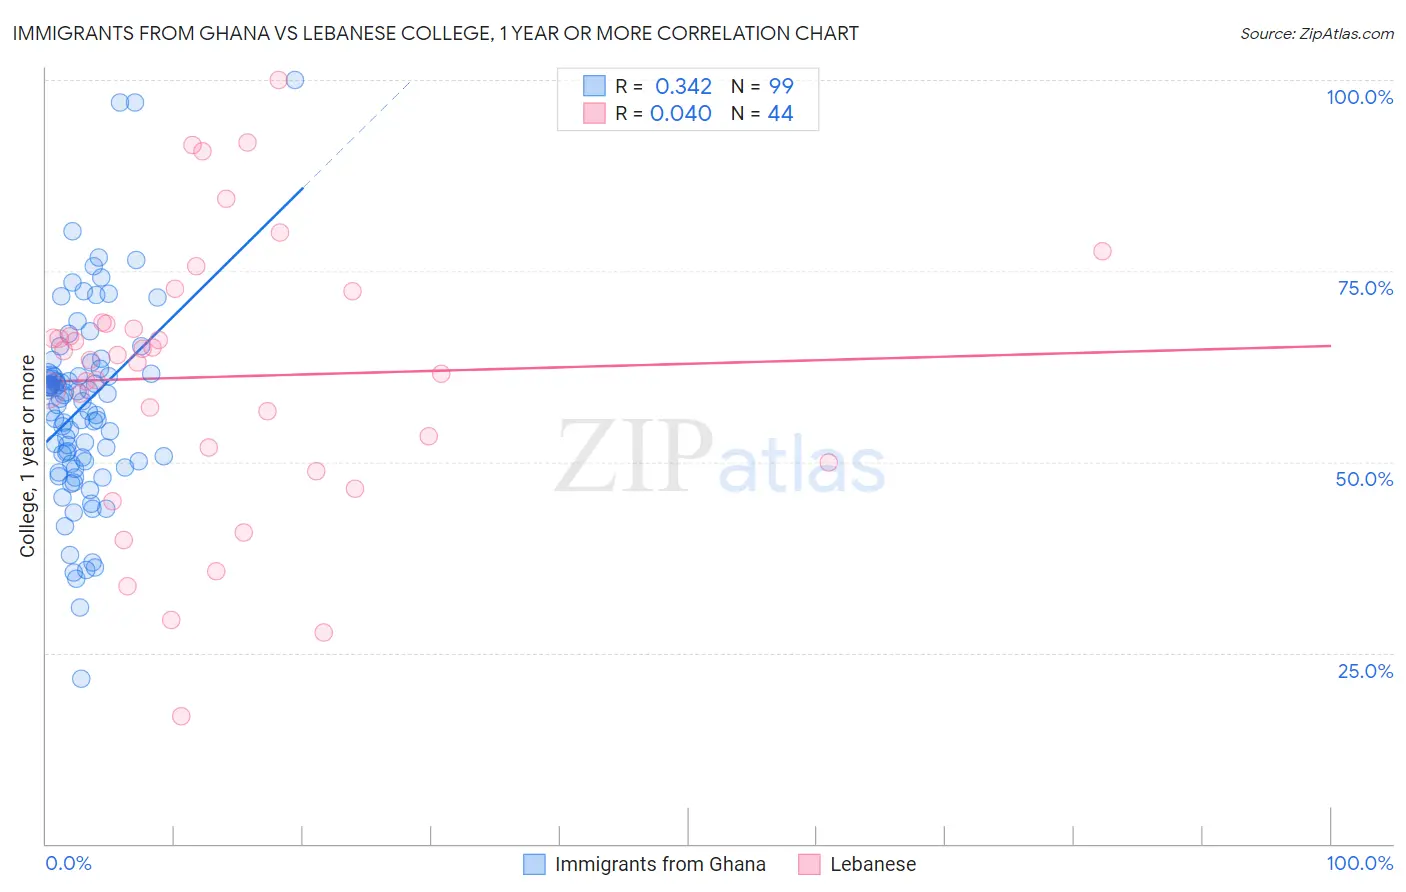
Immigrants from Ghana vs Lebanese College, 1 year or more Correlation Chart
The statistical analysis conducted on geographies consisting of 199,951,982 people shows a mild positive correlation between the proportion of Immigrants from Ghana and percentage of population with at least college, 1 year or more education in the United States with a correlation coefficient (R) of 0.342 and weighted average of 57.4%. Similarly, the statistical analysis conducted on geographies consisting of 401,622,274 people shows no correlation between the proportion of Lebanese and percentage of population with at least college, 1 year or more education in the United States with a correlation coefficient (R) of 0.040 and weighted average of 61.6%, a difference of 7.2%.
College, 1 year or more Correlation Summary
| Measurement | Immigrants from Ghana | Lebanese |
| Minimum | 21.7% | 16.6% |
| Maximum | 100.0% | 100.0% |
| Range | 78.3% | 83.4% |
| Mean | 57.3% | 61.1% |
| Median | 58.2% | 63.7% |
| Interquartile 25% (IQ1) | 50.0% | 50.9% |
| Interquartile 75% (IQ3) | 61.5% | 68.2% |
| Interquartile Range (IQR) | 11.5% | 17.3% |
| Standard Deviation (Sample) | 12.8% | 17.8% |
| Standard Deviation (Population) | 12.7% | 17.6% |
Similar Demographics by College, 1 year or more
Demographics Similar to Immigrants from Ghana by College, 1 year or more
In terms of college, 1 year or more, the demographic groups most similar to Immigrants from Ghana are Immigrants from Costa Rica (57.5%, a difference of 0.070%), White/Caucasian (57.6%, a difference of 0.19%), Immigrants from Panama (57.6%, a difference of 0.25%), Native Hawaiian (57.6%, a difference of 0.25%), and Subsaharan African (57.3%, a difference of 0.34%).
| Demographics | Rating | Rank | College, 1 year or more |
| Immigrants | Colombia | 11.6 /100 | #214 | Poor 57.8% |
| Tongans | 11.6 /100 | #215 | Poor 57.8% |
| Immigrants | Peru | 10.6 /100 | #216 | Poor 57.7% |
| Immigrants | Panama | 9.1 /100 | #217 | Tragic 57.6% |
| Native Hawaiians | 9.0 /100 | #218 | Tragic 57.6% |
| Whites/Caucasians | 8.7 /100 | #219 | Tragic 57.6% |
| Immigrants | Costa Rica | 8.0 /100 | #220 | Tragic 57.5% |
| Immigrants | Ghana | 7.7 /100 | #221 | Tragic 57.4% |
| Sub-Saharan Africans | 6.1 /100 | #222 | Tragic 57.3% |
| Portuguese | 5.4 /100 | #223 | Tragic 57.2% |
| Hmong | 5.4 /100 | #224 | Tragic 57.2% |
| Vietnamese | 4.7 /100 | #225 | Tragic 57.0% |
| Immigrants | Western Africa | 4.6 /100 | #226 | Tragic 57.0% |
| Immigrants | Immigrants | 4.4 /100 | #227 | Tragic 57.0% |
| Immigrants | Fiji | 4.0 /100 | #228 | Tragic 56.9% |
Demographics Similar to Lebanese by College, 1 year or more
In terms of college, 1 year or more, the demographic groups most similar to Lebanese are Arab (61.6%, a difference of 0.040%), Immigrants from Brazil (61.6%, a difference of 0.050%), Norwegian (61.7%, a difference of 0.10%), Danish (61.7%, a difference of 0.17%), and Assyrian/Chaldean/Syriac (61.5%, a difference of 0.18%).
| Demographics | Rating | Rank | College, 1 year or more |
| Immigrants | Northern Africa | 95.7 /100 | #109 | Exceptional 61.9% |
| Europeans | 95.6 /100 | #110 | Exceptional 61.8% |
| Macedonians | 95.6 /100 | #111 | Exceptional 61.8% |
| Austrians | 95.4 /100 | #112 | Exceptional 61.8% |
| Ukrainians | 95.2 /100 | #113 | Exceptional 61.8% |
| Danes | 94.8 /100 | #114 | Exceptional 61.7% |
| Norwegians | 94.5 /100 | #115 | Exceptional 61.7% |
| Lebanese | 94.1 /100 | #116 | Exceptional 61.6% |
| Arabs | 93.9 /100 | #117 | Exceptional 61.6% |
| Immigrants | Brazil | 93.9 /100 | #118 | Exceptional 61.6% |
| Assyrians/Chaldeans/Syriacs | 93.3 /100 | #119 | Exceptional 61.5% |
| Pakistanis | 93.2 /100 | #120 | Exceptional 61.5% |
| Immigrants | Jordan | 92.7 /100 | #121 | Exceptional 61.4% |
| Immigrants | Chile | 92.3 /100 | #122 | Exceptional 61.4% |
| Serbians | 92.2 /100 | #123 | Exceptional 61.4% |