Hispanic or Latino vs Immigrants from Panama College, 1 year or more
COMPARE
Hispanic or Latino
Immigrants from Panama
College, 1 year or more
College, 1 year or more Comparison
Hispanics or Latinos
Immigrants from Panama
51.1%
COLLEGE, 1 YEAR OR MORE
0.0/ 100
METRIC RATING
317th/ 347
METRIC RANK
57.6%
COLLEGE, 1 YEAR OR MORE
9.1/ 100
METRIC RATING
217th/ 347
METRIC RANK
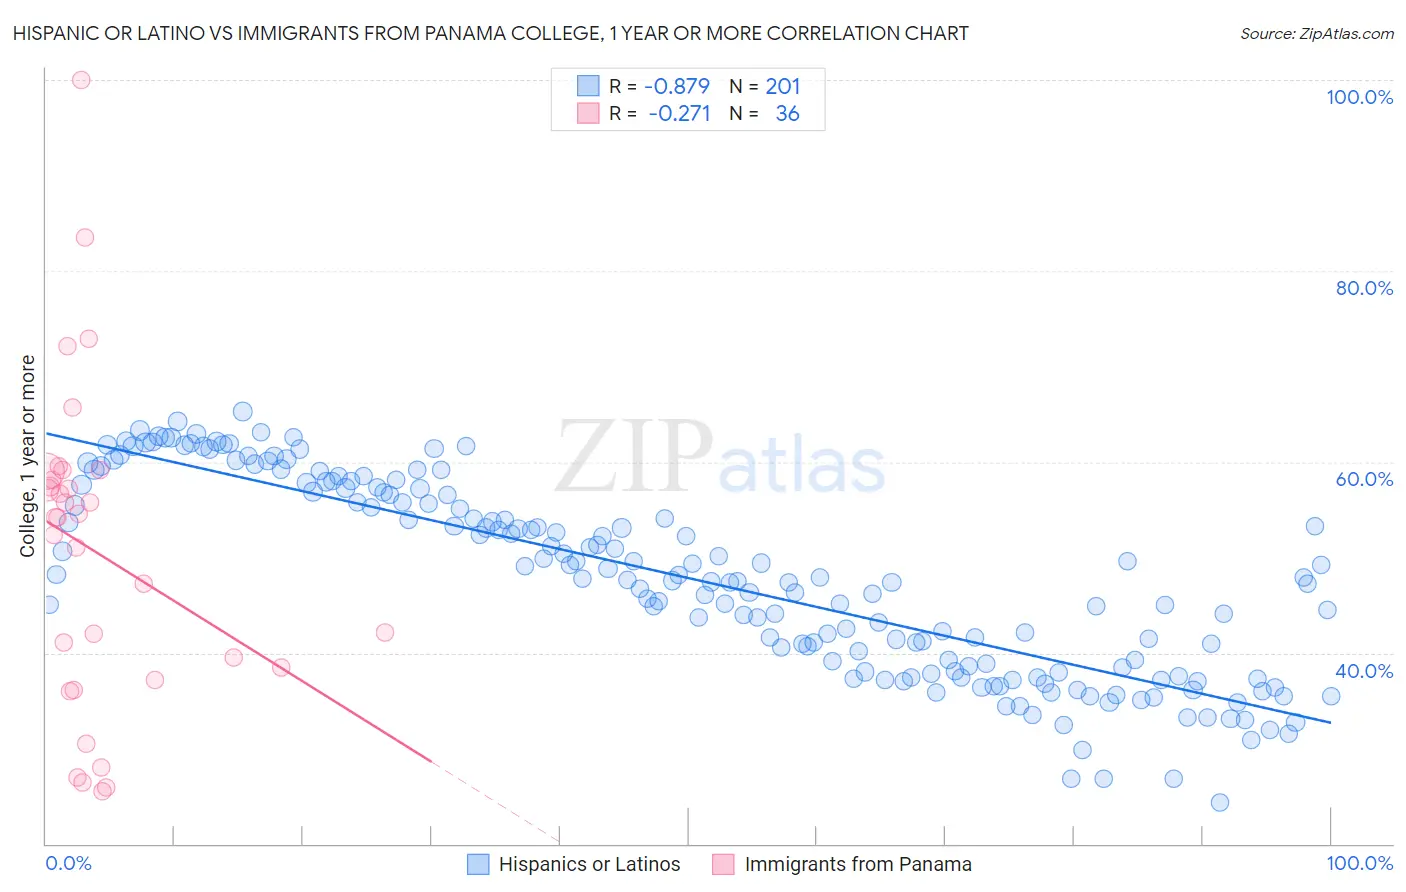
Hispanic or Latino vs Immigrants from Panama College, 1 year or more Correlation Chart
The statistical analysis conducted on geographies consisting of 578,586,619 people shows a very strong negative correlation between the proportion of Hispanics or Latinos and percentage of population with at least college, 1 year or more education in the United States with a correlation coefficient (R) of -0.879 and weighted average of 51.1%. Similarly, the statistical analysis conducted on geographies consisting of 221,184,524 people shows a weak negative correlation between the proportion of Immigrants from Panama and percentage of population with at least college, 1 year or more education in the United States with a correlation coefficient (R) of -0.271 and weighted average of 57.6%, a difference of 12.7%.
College, 1 year or more Correlation Summary
| Measurement | Hispanic or Latino | Immigrants from Panama |
| Minimum | 24.4% | 25.5% |
| Maximum | 65.3% | 100.0% |
| Range | 40.9% | 74.5% |
| Mean | 47.8% | 50.5% |
| Median | 47.8% | 54.2% |
| Interquartile 25% (IQ1) | 38.2% | 37.8% |
| Interquartile 75% (IQ3) | 57.0% | 58.5% |
| Interquartile Range (IQR) | 18.8% | 20.7% |
| Standard Deviation (Sample) | 10.0% | 16.7% |
| Standard Deviation (Population) | 10.0% | 16.5% |
Similar Demographics by College, 1 year or more
Demographics Similar to Hispanics or Latinos by College, 1 year or more
In terms of college, 1 year or more, the demographic groups most similar to Hispanics or Latinos are Cajun (51.2%, a difference of 0.090%), Immigrants from Honduras (51.0%, a difference of 0.13%), Guatemalan (51.2%, a difference of 0.16%), Immigrants from El Salvador (51.0%, a difference of 0.22%), and Kiowa (51.0%, a difference of 0.28%).
| Demographics | Rating | Rank | College, 1 year or more |
| Hondurans | 0.0 /100 | #310 | Tragic 51.6% |
| Immigrants | Haiti | 0.0 /100 | #311 | Tragic 51.5% |
| Pueblo | 0.0 /100 | #312 | Tragic 51.5% |
| Immigrants | Caribbean | 0.0 /100 | #313 | Tragic 51.4% |
| Fijians | 0.0 /100 | #314 | Tragic 51.3% |
| Guatemalans | 0.0 /100 | #315 | Tragic 51.2% |
| Cajuns | 0.0 /100 | #316 | Tragic 51.2% |
| Hispanics or Latinos | 0.0 /100 | #317 | Tragic 51.1% |
| Immigrants | Honduras | 0.0 /100 | #318 | Tragic 51.0% |
| Immigrants | El Salvador | 0.0 /100 | #319 | Tragic 51.0% |
| Kiowa | 0.0 /100 | #320 | Tragic 51.0% |
| Hopi | 0.0 /100 | #321 | Tragic 50.9% |
| Navajo | 0.0 /100 | #322 | Tragic 50.8% |
| Immigrants | Guatemala | 0.0 /100 | #323 | Tragic 50.7% |
| Immigrants | Cuba | 0.0 /100 | #324 | Tragic 50.7% |
Demographics Similar to Immigrants from Panama by College, 1 year or more
In terms of college, 1 year or more, the demographic groups most similar to Immigrants from Panama are Native Hawaiian (57.6%, a difference of 0.0%), White/Caucasian (57.6%, a difference of 0.070%), Immigrants from Costa Rica (57.5%, a difference of 0.19%), Immigrants from Peru (57.7%, a difference of 0.24%), and Immigrants from Ghana (57.4%, a difference of 0.25%).
| Demographics | Rating | Rank | College, 1 year or more |
| Tsimshian | 13.5 /100 | #210 | Poor 57.9% |
| Immigrants | Nigeria | 13.3 /100 | #211 | Poor 57.9% |
| Immigrants | Senegal | 11.8 /100 | #212 | Poor 57.8% |
| French Canadians | 11.8 /100 | #213 | Poor 57.8% |
| Immigrants | Colombia | 11.6 /100 | #214 | Poor 57.8% |
| Tongans | 11.6 /100 | #215 | Poor 57.8% |
| Immigrants | Peru | 10.6 /100 | #216 | Poor 57.7% |
| Immigrants | Panama | 9.1 /100 | #217 | Tragic 57.6% |
| Native Hawaiians | 9.0 /100 | #218 | Tragic 57.6% |
| Whites/Caucasians | 8.7 /100 | #219 | Tragic 57.6% |
| Immigrants | Costa Rica | 8.0 /100 | #220 | Tragic 57.5% |
| Immigrants | Ghana | 7.7 /100 | #221 | Tragic 57.4% |
| Sub-Saharan Africans | 6.1 /100 | #222 | Tragic 57.3% |
| Portuguese | 5.4 /100 | #223 | Tragic 57.2% |
| Hmong | 5.4 /100 | #224 | Tragic 57.2% |