Immigrants from Ghana vs Comanche In Labor Force | Age 30-34
COMPARE
Immigrants from Ghana
Comanche
In Labor Force | Age 30-34
In Labor Force | Age 30-34 Comparison
Immigrants from Ghana
Comanche
85.2%
IN LABOR FORCE | AGE 30-34
96.5/ 100
METRIC RATING
104th/ 347
METRIC RANK
82.6%
IN LABOR FORCE | AGE 30-34
0.0/ 100
METRIC RATING
297th/ 347
METRIC RANK
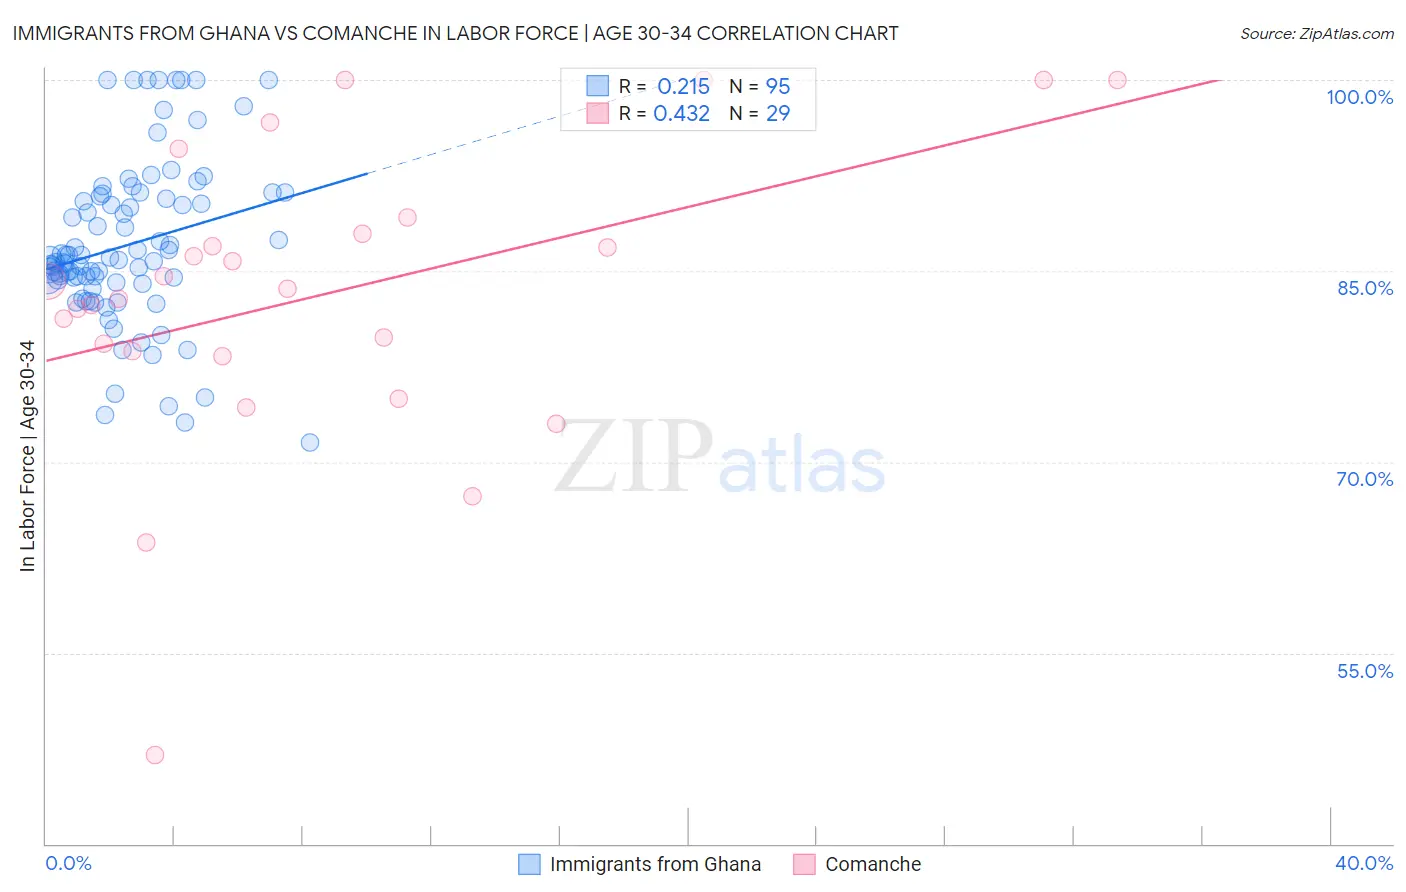
Immigrants from Ghana vs Comanche In Labor Force | Age 30-34 Correlation Chart
The statistical analysis conducted on geographies consisting of 199,865,631 people shows a weak positive correlation between the proportion of Immigrants from Ghana and labor force participation rate among population between the ages 30 and 34 in the United States with a correlation coefficient (R) of 0.215 and weighted average of 85.2%. Similarly, the statistical analysis conducted on geographies consisting of 109,766,840 people shows a moderate positive correlation between the proportion of Comanche and labor force participation rate among population between the ages 30 and 34 in the United States with a correlation coefficient (R) of 0.432 and weighted average of 82.6%, a difference of 3.2%.
In Labor Force | Age 30-34 Correlation Summary
| Measurement | Immigrants from Ghana | Comanche |
| Minimum | 71.5% | 46.9% |
| Maximum | 100.0% | 100.0% |
| Range | 28.5% | 53.1% |
| Mean | 87.0% | 83.1% |
| Median | 85.8% | 83.6% |
| Interquartile 25% (IQ1) | 84.1% | 78.5% |
| Interquartile 75% (IQ3) | 90.9% | 88.5% |
| Interquartile Range (IQR) | 6.8% | 10.0% |
| Standard Deviation (Sample) | 6.4% | 11.7% |
| Standard Deviation (Population) | 6.4% | 11.5% |
Similar Demographics by In Labor Force | Age 30-34
Demographics Similar to Immigrants from Ghana by In Labor Force | Age 30-34
In terms of in labor force | age 30-34, the demographic groups most similar to Immigrants from Ghana are Ukrainian (85.2%, a difference of 0.0%), Immigrants from Austria (85.2%, a difference of 0.010%), Alsatian (85.2%, a difference of 0.010%), Immigrants from Middle Africa (85.2%, a difference of 0.010%), and Immigrants from Northern Africa (85.2%, a difference of 0.010%).
| Demographics | Rating | Rank | In Labor Force | Age 30-34 |
| Thais | 97.2 /100 | #97 | Exceptional 85.2% |
| Immigrants | Uganda | 97.2 /100 | #98 | Exceptional 85.2% |
| Belgians | 97.2 /100 | #99 | Exceptional 85.2% |
| Sudanese | 97.1 /100 | #100 | Exceptional 85.2% |
| Immigrants | Belarus | 96.9 /100 | #101 | Exceptional 85.2% |
| Immigrants | Austria | 96.8 /100 | #102 | Exceptional 85.2% |
| Ukrainians | 96.6 /100 | #103 | Exceptional 85.2% |
| Immigrants | Ghana | 96.5 /100 | #104 | Exceptional 85.2% |
| Alsatians | 96.3 /100 | #105 | Exceptional 85.2% |
| Immigrants | Middle Africa | 96.3 /100 | #106 | Exceptional 85.2% |
| Immigrants | Northern Africa | 96.3 /100 | #107 | Exceptional 85.2% |
| Immigrants | Zimbabwe | 95.8 /100 | #108 | Exceptional 85.1% |
| Argentineans | 95.8 /100 | #109 | Exceptional 85.1% |
| Immigrants | South Africa | 95.3 /100 | #110 | Exceptional 85.1% |
| Immigrants | Scotland | 94.9 /100 | #111 | Exceptional 85.1% |
Demographics Similar to Comanche by In Labor Force | Age 30-34
In terms of in labor force | age 30-34, the demographic groups most similar to Comanche are Aleut (82.6%, a difference of 0.0%), Chippewa (82.6%, a difference of 0.010%), Pennsylvania German (82.6%, a difference of 0.030%), Immigrants from Central America (82.5%, a difference of 0.13%), and American (82.7%, a difference of 0.15%).
| Demographics | Rating | Rank | In Labor Force | Age 30-34 |
| Blackfeet | 0.0 /100 | #290 | Tragic 82.8% |
| Potawatomi | 0.0 /100 | #291 | Tragic 82.8% |
| Blacks/African Americans | 0.0 /100 | #292 | Tragic 82.8% |
| Nepalese | 0.0 /100 | #293 | Tragic 82.7% |
| Americans | 0.0 /100 | #294 | Tragic 82.7% |
| Pennsylvania Germans | 0.0 /100 | #295 | Tragic 82.6% |
| Chippewa | 0.0 /100 | #296 | Tragic 82.6% |
| Comanche | 0.0 /100 | #297 | Tragic 82.6% |
| Aleuts | 0.0 /100 | #298 | Tragic 82.6% |
| Immigrants | Central America | 0.0 /100 | #299 | Tragic 82.5% |
| Hmong | 0.0 /100 | #300 | Tragic 82.4% |
| Hispanics or Latinos | 0.0 /100 | #301 | Tragic 82.4% |
| Ottawa | 0.0 /100 | #302 | Tragic 82.4% |
| Immigrants | Micronesia | 0.0 /100 | #303 | Tragic 82.4% |
| Tlingit-Haida | 0.0 /100 | #304 | Tragic 82.3% |