Immigrants from Eritrea vs Arapaho Unemployment Among Ages 55 to 59 years
COMPARE
Immigrants from Eritrea
Arapaho
Unemployment Among Ages 55 to 59 years
Unemployment Among Ages 55 to 59 years Comparison
Immigrants from Eritrea
Arapaho
4.4%
UNEMPLOYMENT AMONG AGES 55 TO 59 YEARS
100.0/ 100
METRIC RATING
25th/ 347
METRIC RANK
6.1%
UNEMPLOYMENT AMONG AGES 55 TO 59 YEARS
0.0/ 100
METRIC RATING
327th/ 347
METRIC RANK
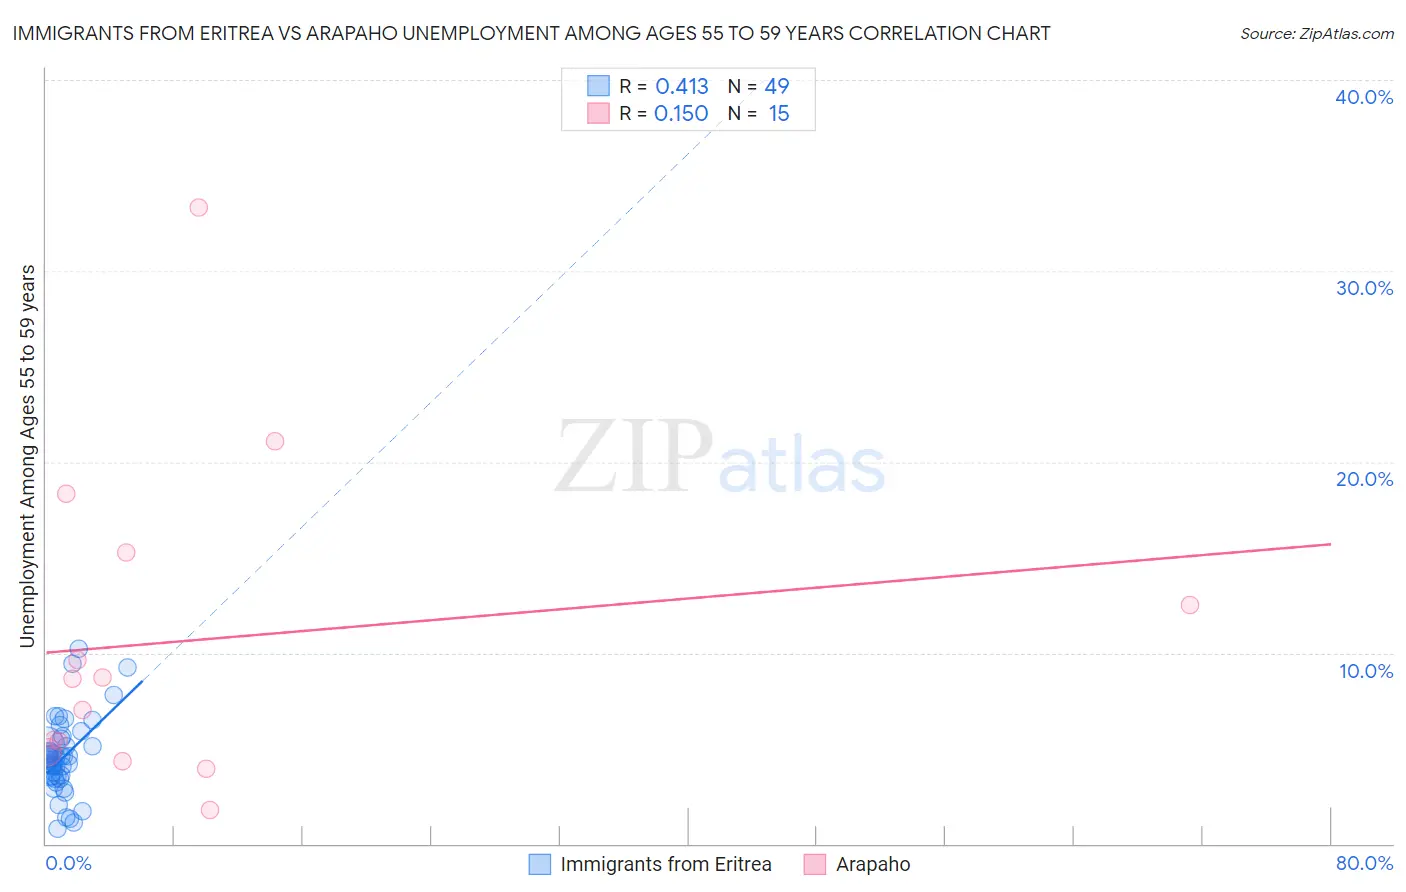
Immigrants from Eritrea vs Arapaho Unemployment Among Ages 55 to 59 years Correlation Chart
The statistical analysis conducted on geographies consisting of 103,259,839 people shows a moderate positive correlation between the proportion of Immigrants from Eritrea and unemployment rate among population between the ages 55 and 59 in the United States with a correlation coefficient (R) of 0.413 and weighted average of 4.4%. Similarly, the statistical analysis conducted on geographies consisting of 28,926,135 people shows a poor positive correlation between the proportion of Arapaho and unemployment rate among population between the ages 55 and 59 in the United States with a correlation coefficient (R) of 0.150 and weighted average of 6.1%, a difference of 36.3%.
Unemployment Among Ages 55 to 59 years Correlation Summary
| Measurement | Immigrants from Eritrea | Arapaho |
| Minimum | 0.80% | 1.8% |
| Maximum | 10.2% | 33.3% |
| Range | 9.4% | 31.5% |
| Mean | 4.5% | 10.7% |
| Median | 4.5% | 8.6% |
| Interquartile 25% (IQ1) | 3.5% | 4.8% |
| Interquartile 75% (IQ3) | 5.3% | 15.2% |
| Interquartile Range (IQR) | 1.9% | 10.5% |
| Standard Deviation (Sample) | 2.0% | 8.4% |
| Standard Deviation (Population) | 2.0% | 8.1% |
Similar Demographics by Unemployment Among Ages 55 to 59 years
Demographics Similar to Immigrants from Eritrea by Unemployment Among Ages 55 to 59 years
In terms of unemployment among ages 55 to 59 years, the demographic groups most similar to Immigrants from Eritrea are Jordanian (4.4%, a difference of 0.010%), Scandinavian (4.5%, a difference of 0.17%), Immigrants from Zimbabwe (4.5%, a difference of 0.18%), Immigrants from Eastern Africa (4.5%, a difference of 0.22%), and Palestinian (4.5%, a difference of 0.26%).
| Demographics | Rating | Rank | Unemployment Among Ages 55 to 59 years |
| Immigrants | Somalia | 100.0 /100 | #18 | Exceptional 4.4% |
| Chinese | 100.0 /100 | #19 | Exceptional 4.4% |
| Swedes | 100.0 /100 | #20 | Exceptional 4.4% |
| Puget Sound Salish | 100.0 /100 | #21 | Exceptional 4.4% |
| Immigrants | Burma/Myanmar | 100.0 /100 | #22 | Exceptional 4.4% |
| Kenyans | 100.0 /100 | #23 | Exceptional 4.4% |
| Jordanians | 100.0 /100 | #24 | Exceptional 4.4% |
| Immigrants | Eritrea | 100.0 /100 | #25 | Exceptional 4.4% |
| Scandinavians | 99.9 /100 | #26 | Exceptional 4.5% |
| Immigrants | Zimbabwe | 99.9 /100 | #27 | Exceptional 4.5% |
| Immigrants | Eastern Africa | 99.9 /100 | #28 | Exceptional 4.5% |
| Palestinians | 99.9 /100 | #29 | Exceptional 4.5% |
| Immigrants | Kenya | 99.9 /100 | #30 | Exceptional 4.5% |
| Germans | 99.9 /100 | #31 | Exceptional 4.5% |
| Immigrants | Ethiopia | 99.9 /100 | #32 | Exceptional 4.5% |
Demographics Similar to Arapaho by Unemployment Among Ages 55 to 59 years
In terms of unemployment among ages 55 to 59 years, the demographic groups most similar to Arapaho are Native/Alaskan (6.0%, a difference of 0.88%), Yuman (6.1%, a difference of 1.2%), Immigrants from Armenia (6.0%, a difference of 1.3%), Dominican (6.2%, a difference of 2.6%), and Vietnamese (5.9%, a difference of 3.0%).
| Demographics | Rating | Rank | Unemployment Among Ages 55 to 59 years |
| Immigrants | Azores | 0.0 /100 | #320 | Tragic 5.8% |
| Chippewa | 0.0 /100 | #321 | Tragic 5.9% |
| Crow | 0.0 /100 | #322 | Tragic 5.9% |
| Immigrants | Bangladesh | 0.0 /100 | #323 | Tragic 5.9% |
| Vietnamese | 0.0 /100 | #324 | Tragic 5.9% |
| Immigrants | Armenia | 0.0 /100 | #325 | Tragic 6.0% |
| Natives/Alaskans | 0.0 /100 | #326 | Tragic 6.0% |
| Arapaho | 0.0 /100 | #327 | Tragic 6.1% |
| Yuman | 0.0 /100 | #328 | Tragic 6.1% |
| Dominicans | 0.0 /100 | #329 | Tragic 6.2% |
| Alaska Natives | 0.0 /100 | #330 | Tragic 6.2% |
| Immigrants | Dominican Republic | 0.0 /100 | #331 | Tragic 6.3% |
| Aleuts | 0.0 /100 | #332 | Tragic 6.4% |
| Pima | 0.0 /100 | #333 | Tragic 6.6% |
| Pueblo | 0.0 /100 | #334 | Tragic 6.7% |