Immigrants from El Salvador vs Immigrants from Fiji Bachelor's Degree
COMPARE
Immigrants from El Salvador
Immigrants from Fiji
Bachelor's Degree
Bachelor's Degree Comparison
Immigrants from El Salvador
Immigrants from Fiji
31.3%
BACHELOR'S DEGREE
0.1/ 100
METRIC RATING
286th/ 347
METRIC RANK
33.7%
BACHELOR'S DEGREE
1.2/ 100
METRIC RATING
245th/ 347
METRIC RANK
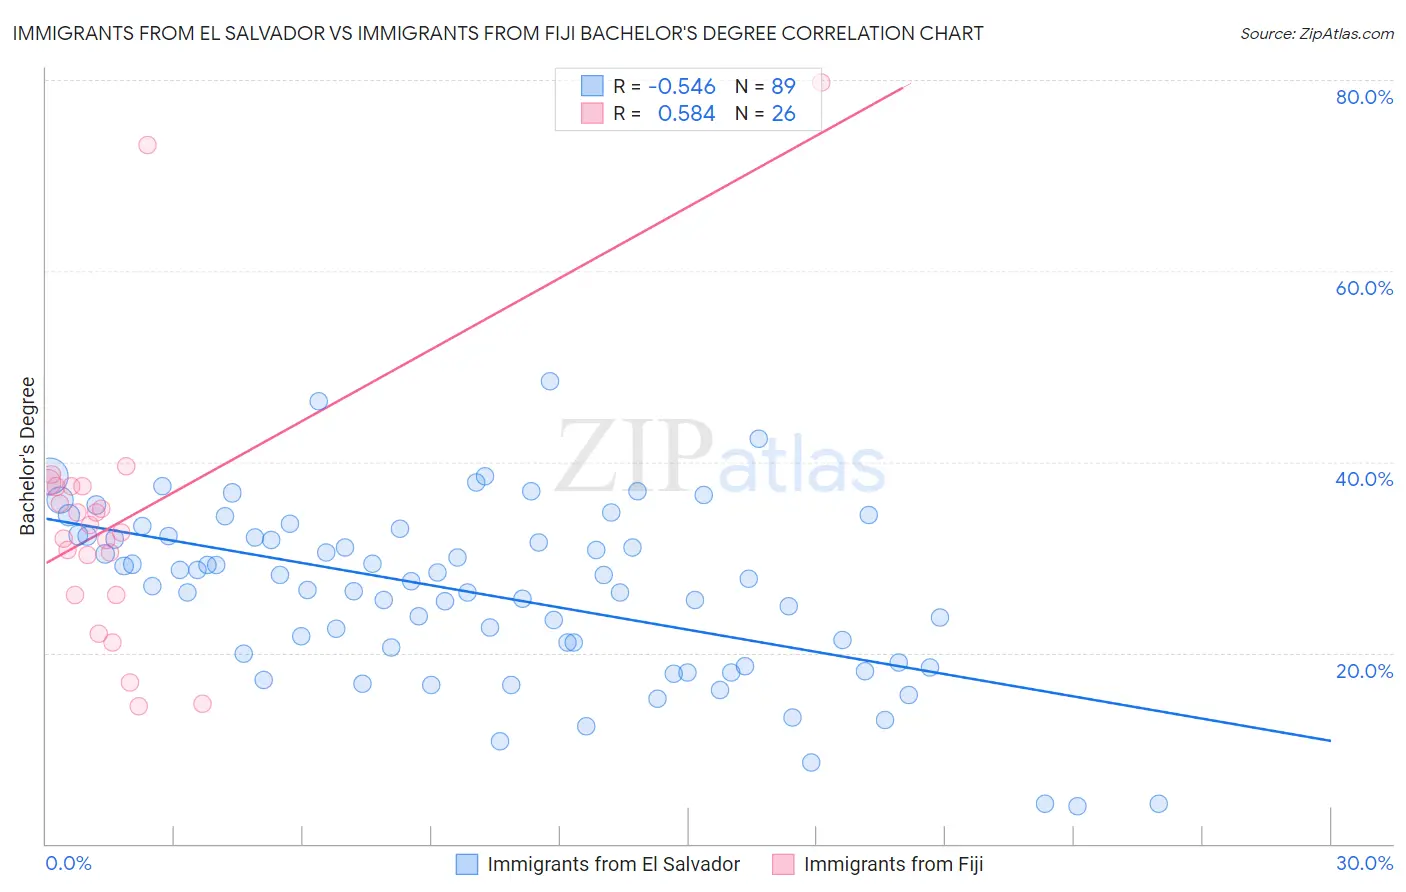
Immigrants from El Salvador vs Immigrants from Fiji Bachelor's Degree Correlation Chart
The statistical analysis conducted on geographies consisting of 357,832,054 people shows a substantial negative correlation between the proportion of Immigrants from El Salvador and percentage of population with at least bachelor's degree education in the United States with a correlation coefficient (R) of -0.546 and weighted average of 31.3%. Similarly, the statistical analysis conducted on geographies consisting of 93,755,724 people shows a substantial positive correlation between the proportion of Immigrants from Fiji and percentage of population with at least bachelor's degree education in the United States with a correlation coefficient (R) of 0.584 and weighted average of 33.7%, a difference of 7.8%.
Bachelor's Degree Correlation Summary
| Measurement | Immigrants from El Salvador | Immigrants from Fiji |
| Minimum | 3.9% | 14.4% |
| Maximum | 48.5% | 79.8% |
| Range | 44.6% | 65.4% |
| Mean | 26.3% | 34.0% |
| Median | 27.5% | 33.0% |
| Interquartile 25% (IQ1) | 19.4% | 26.1% |
| Interquartile 75% (IQ3) | 32.2% | 37.5% |
| Interquartile Range (IQR) | 12.8% | 11.4% |
| Standard Deviation (Sample) | 9.0% | 14.5% |
| Standard Deviation (Population) | 8.9% | 14.3% |
Similar Demographics by Bachelor's Degree
Demographics Similar to Immigrants from El Salvador by Bachelor's Degree
In terms of bachelor's degree, the demographic groups most similar to Immigrants from El Salvador are Aleut (31.3%, a difference of 0.050%), Haitian (31.3%, a difference of 0.070%), Honduran (31.3%, a difference of 0.10%), Immigrants from Caribbean (31.4%, a difference of 0.38%), and Blackfeet (31.5%, a difference of 0.52%).
| Demographics | Rating | Rank | Bachelor's Degree |
| Hawaiians | 0.1 /100 | #279 | Tragic 31.6% |
| Immigrants | Laos | 0.1 /100 | #280 | Tragic 31.6% |
| Blackfeet | 0.1 /100 | #281 | Tragic 31.5% |
| Immigrants | Caribbean | 0.1 /100 | #282 | Tragic 31.4% |
| Hondurans | 0.1 /100 | #283 | Tragic 31.3% |
| Haitians | 0.1 /100 | #284 | Tragic 31.3% |
| Aleuts | 0.1 /100 | #285 | Tragic 31.3% |
| Immigrants | El Salvador | 0.1 /100 | #286 | Tragic 31.3% |
| Ottawa | 0.1 /100 | #287 | Tragic 31.1% |
| Guatemalans | 0.1 /100 | #288 | Tragic 31.0% |
| Puerto Ricans | 0.1 /100 | #289 | Tragic 31.0% |
| Immigrants | Honduras | 0.1 /100 | #290 | Tragic 30.9% |
| Blacks/African Americans | 0.1 /100 | #291 | Tragic 30.9% |
| Ute | 0.1 /100 | #292 | Tragic 30.9% |
| Cape Verdeans | 0.1 /100 | #293 | Tragic 30.9% |
Demographics Similar to Immigrants from Fiji by Bachelor's Degree
In terms of bachelor's degree, the demographic groups most similar to Immigrants from Fiji are Delaware (33.8%, a difference of 0.090%), Jamaican (33.6%, a difference of 0.36%), Immigrants from Congo (33.6%, a difference of 0.45%), Cree (33.6%, a difference of 0.47%), and Immigrants from Guyana (33.9%, a difference of 0.59%).
| Demographics | Rating | Rank | Bachelor's Degree |
| Guyanese | 2.5 /100 | #238 | Tragic 34.5% |
| British West Indians | 2.5 /100 | #239 | Tragic 34.5% |
| Tongans | 2.0 /100 | #240 | Tragic 34.3% |
| Immigrants | Cambodia | 1.9 /100 | #241 | Tragic 34.2% |
| Immigrants | Nonimmigrants | 1.8 /100 | #242 | Tragic 34.2% |
| Immigrants | Guyana | 1.4 /100 | #243 | Tragic 33.9% |
| Delaware | 1.2 /100 | #244 | Tragic 33.8% |
| Immigrants | Fiji | 1.2 /100 | #245 | Tragic 33.7% |
| Jamaicans | 1.0 /100 | #246 | Tragic 33.6% |
| Immigrants | Congo | 1.0 /100 | #247 | Tragic 33.6% |
| Cree | 1.0 /100 | #248 | Tragic 33.6% |
| Immigrants | Liberia | 0.9 /100 | #249 | Tragic 33.5% |
| Indonesians | 0.9 /100 | #250 | Tragic 33.5% |
| Japanese | 0.7 /100 | #251 | Tragic 33.3% |
| Immigrants | Bahamas | 0.7 /100 | #252 | Tragic 33.3% |