Immigrants from El Salvador vs New Zealander Bachelor's Degree
COMPARE
Immigrants from El Salvador
New Zealander
Bachelor's Degree
Bachelor's Degree Comparison
Immigrants from El Salvador
New Zealanders
31.3%
BACHELOR'S DEGREE
0.1/ 100
METRIC RATING
286th/ 347
METRIC RANK
44.0%
BACHELOR'S DEGREE
99.9/ 100
METRIC RATING
60th/ 347
METRIC RANK
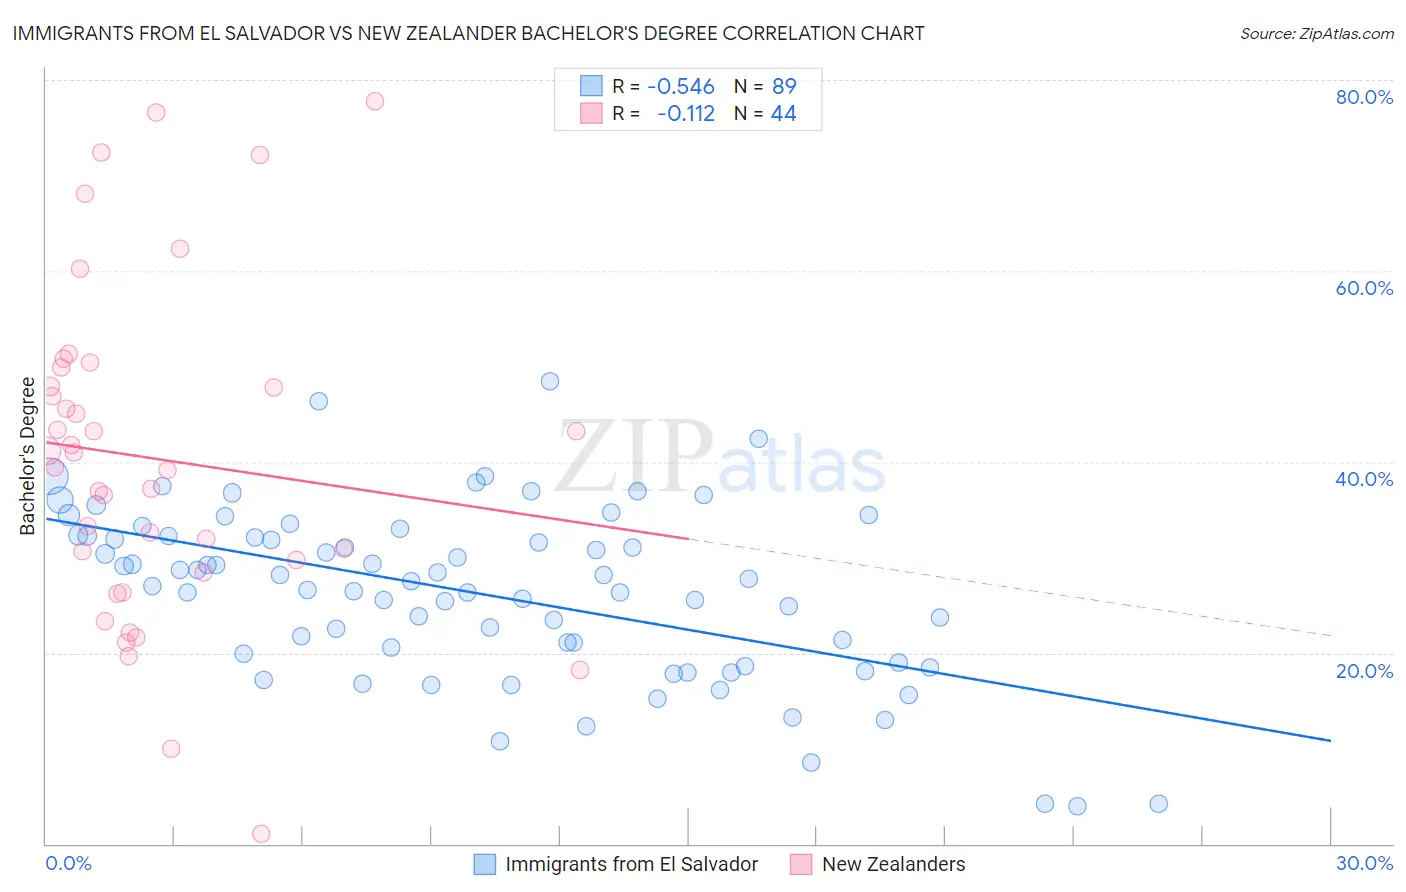
Immigrants from El Salvador vs New Zealander Bachelor's Degree Correlation Chart
The statistical analysis conducted on geographies consisting of 357,832,054 people shows a substantial negative correlation between the proportion of Immigrants from El Salvador and percentage of population with at least bachelor's degree education in the United States with a correlation coefficient (R) of -0.546 and weighted average of 31.3%. Similarly, the statistical analysis conducted on geographies consisting of 106,915,831 people shows a poor negative correlation between the proportion of New Zealanders and percentage of population with at least bachelor's degree education in the United States with a correlation coefficient (R) of -0.112 and weighted average of 44.0%, a difference of 40.5%.
Bachelor's Degree Correlation Summary
| Measurement | Immigrants from El Salvador | New Zealander |
| Minimum | 3.9% | 1.0% |
| Maximum | 48.5% | 77.8% |
| Range | 44.6% | 76.8% |
| Mean | 26.3% | 40.3% |
| Median | 27.5% | 40.2% |
| Interquartile 25% (IQ1) | 19.4% | 29.1% |
| Interquartile 75% (IQ3) | 32.2% | 48.9% |
| Interquartile Range (IQR) | 12.8% | 19.8% |
| Standard Deviation (Sample) | 9.0% | 17.3% |
| Standard Deviation (Population) | 8.9% | 17.1% |
Similar Demographics by Bachelor's Degree
Demographics Similar to Immigrants from El Salvador by Bachelor's Degree
In terms of bachelor's degree, the demographic groups most similar to Immigrants from El Salvador are Aleut (31.3%, a difference of 0.050%), Haitian (31.3%, a difference of 0.070%), Honduran (31.3%, a difference of 0.10%), Immigrants from Caribbean (31.4%, a difference of 0.38%), and Blackfeet (31.5%, a difference of 0.52%).
| Demographics | Rating | Rank | Bachelor's Degree |
| Hawaiians | 0.1 /100 | #279 | Tragic 31.6% |
| Immigrants | Laos | 0.1 /100 | #280 | Tragic 31.6% |
| Blackfeet | 0.1 /100 | #281 | Tragic 31.5% |
| Immigrants | Caribbean | 0.1 /100 | #282 | Tragic 31.4% |
| Hondurans | 0.1 /100 | #283 | Tragic 31.3% |
| Haitians | 0.1 /100 | #284 | Tragic 31.3% |
| Aleuts | 0.1 /100 | #285 | Tragic 31.3% |
| Immigrants | El Salvador | 0.1 /100 | #286 | Tragic 31.3% |
| Ottawa | 0.1 /100 | #287 | Tragic 31.1% |
| Guatemalans | 0.1 /100 | #288 | Tragic 31.0% |
| Puerto Ricans | 0.1 /100 | #289 | Tragic 31.0% |
| Immigrants | Honduras | 0.1 /100 | #290 | Tragic 30.9% |
| Blacks/African Americans | 0.1 /100 | #291 | Tragic 30.9% |
| Ute | 0.1 /100 | #292 | Tragic 30.9% |
| Cape Verdeans | 0.1 /100 | #293 | Tragic 30.9% |
Demographics Similar to New Zealanders by Bachelor's Degree
In terms of bachelor's degree, the demographic groups most similar to New Zealanders are Australian (44.0%, a difference of 0.010%), Immigrants from Czechoslovakia (44.0%, a difference of 0.11%), Paraguayan (44.0%, a difference of 0.16%), Immigrants from Serbia (44.1%, a difference of 0.35%), and Immigrants from Bolivia (44.2%, a difference of 0.53%).
| Demographics | Rating | Rank | Bachelor's Degree |
| Immigrants | Asia | 99.9 /100 | #53 | Exceptional 44.3% |
| Immigrants | Austria | 99.9 /100 | #54 | Exceptional 44.2% |
| Immigrants | Bolivia | 99.9 /100 | #55 | Exceptional 44.2% |
| Immigrants | Serbia | 99.9 /100 | #56 | Exceptional 44.1% |
| Paraguayans | 99.9 /100 | #57 | Exceptional 44.0% |
| Immigrants | Czechoslovakia | 99.9 /100 | #58 | Exceptional 44.0% |
| Australians | 99.9 /100 | #59 | Exceptional 44.0% |
| New Zealanders | 99.9 /100 | #60 | Exceptional 44.0% |
| South Africans | 99.8 /100 | #61 | Exceptional 43.6% |
| Immigrants | Kazakhstan | 99.8 /100 | #62 | Exceptional 43.4% |
| Immigrants | Europe | 99.8 /100 | #63 | Exceptional 43.4% |
| Argentineans | 99.7 /100 | #64 | Exceptional 43.3% |
| Zimbabweans | 99.7 /100 | #65 | Exceptional 43.3% |
| Immigrants | Netherlands | 99.7 /100 | #66 | Exceptional 43.3% |
| Egyptians | 99.7 /100 | #67 | Exceptional 43.3% |