Immigrants from El Salvador vs Immigrants from Fiji 1 or more Vehicles in Household
COMPARE
Immigrants from El Salvador
Immigrants from Fiji
1 or more Vehicles in Household
1 or more Vehicles in Household Comparison
Immigrants from El Salvador
Immigrants from Fiji
89.6%
1 OR MORE VEHICLES IN HOUSEHOLD
44.1/ 100
METRIC RATING
178th/ 347
METRIC RANK
92.2%
1 OR MORE VEHICLES IN HOUSEHOLD
99.9/ 100
METRIC RATING
46th/ 347
METRIC RANK
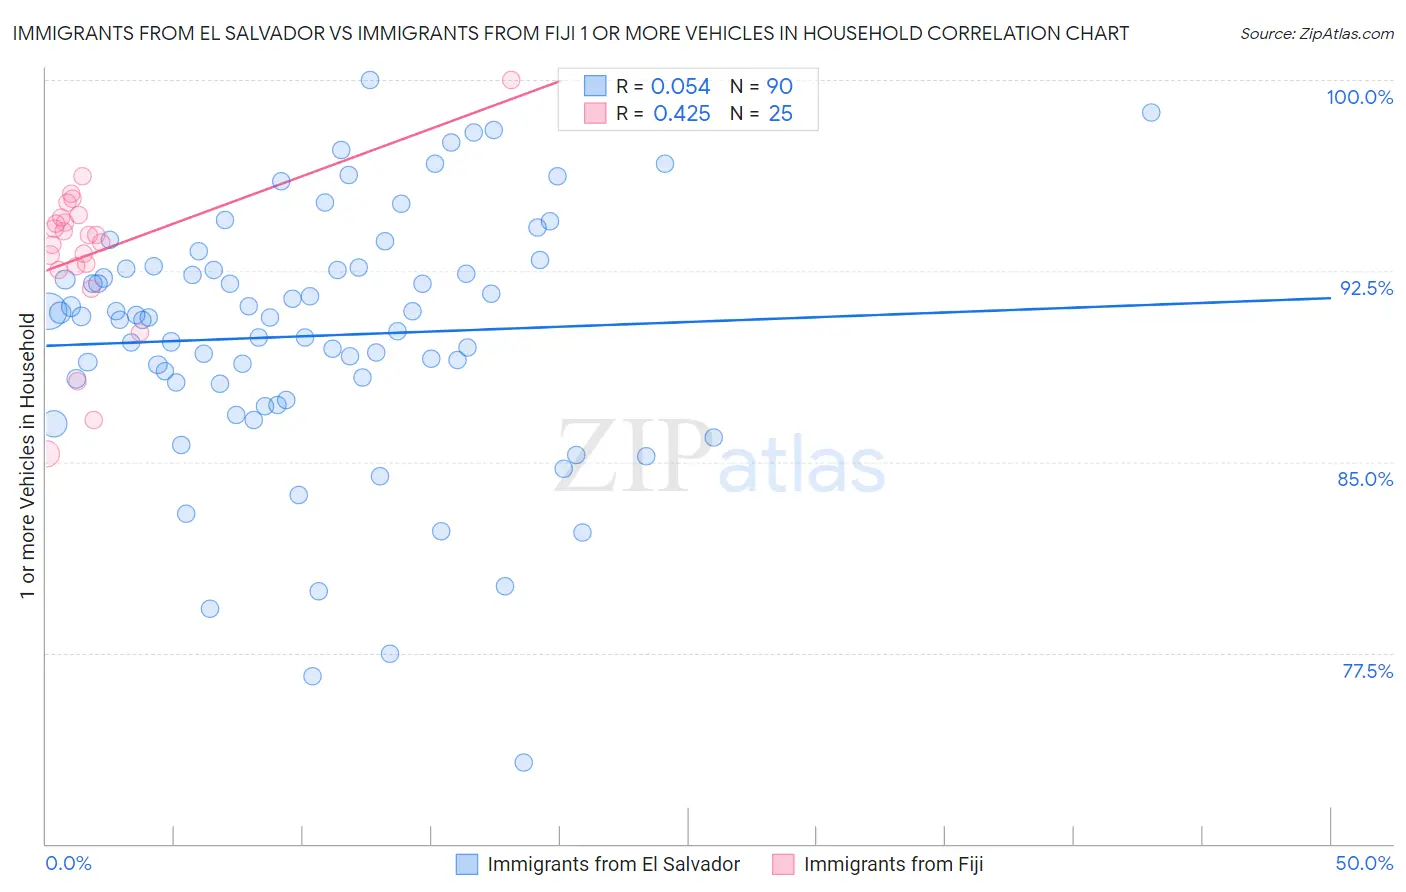
Immigrants from El Salvador vs Immigrants from Fiji 1 or more Vehicles in Household Correlation Chart
The statistical analysis conducted on geographies consisting of 357,719,438 people shows a slight positive correlation between the proportion of Immigrants from El Salvador and percentage of households with 1 or more vehicles available in the United States with a correlation coefficient (R) of 0.054 and weighted average of 89.6%. Similarly, the statistical analysis conducted on geographies consisting of 93,754,900 people shows a moderate positive correlation between the proportion of Immigrants from Fiji and percentage of households with 1 or more vehicles available in the United States with a correlation coefficient (R) of 0.425 and weighted average of 92.2%, a difference of 2.9%.
1 or more Vehicles in Household Correlation Summary
| Measurement | Immigrants from El Salvador | Immigrants from Fiji |
| Minimum | 73.2% | 85.3% |
| Maximum | 100.0% | 100.0% |
| Range | 26.8% | 14.7% |
| Mean | 90.0% | 93.2% |
| Median | 90.7% | 93.9% |
| Interquartile 25% (IQ1) | 88.1% | 92.6% |
| Interquartile 75% (IQ3) | 92.6% | 94.6% |
| Interquartile Range (IQR) | 4.5% | 2.0% |
| Standard Deviation (Sample) | 5.0% | 3.0% |
| Standard Deviation (Population) | 5.0% | 3.0% |
Similar Demographics by 1 or more Vehicles in Household
Demographics Similar to Immigrants from El Salvador by 1 or more Vehicles in Household
In terms of 1 or more vehicles in household, the demographic groups most similar to Immigrants from El Salvador are German Russian (89.6%, a difference of 0.0%), Arab (89.6%, a difference of 0.010%), Hmong (89.6%, a difference of 0.030%), Immigrants from Ethiopia (89.6%, a difference of 0.030%), and Ukrainian (89.6%, a difference of 0.030%).
| Demographics | Rating | Rank | 1 or more Vehicles in Household |
| French American Indians | 54.4 /100 | #171 | Average 89.8% |
| Indonesians | 53.0 /100 | #172 | Average 89.7% |
| Lumbee | 52.8 /100 | #173 | Average 89.7% |
| Filipinos | 50.0 /100 | #174 | Average 89.7% |
| Immigrants | Burma/Myanmar | 47.6 /100 | #175 | Average 89.7% |
| Immigrants | Sudan | 47.1 /100 | #176 | Average 89.7% |
| Hmong | 45.8 /100 | #177 | Average 89.6% |
| Immigrants | El Salvador | 44.1 /100 | #178 | Average 89.6% |
| German Russians | 44.0 /100 | #179 | Average 89.6% |
| Arabs | 43.3 /100 | #180 | Average 89.6% |
| Immigrants | Ethiopia | 42.5 /100 | #181 | Average 89.6% |
| Ukrainians | 42.4 /100 | #182 | Average 89.6% |
| Ethiopians | 41.2 /100 | #183 | Average 89.6% |
| Immigrants | Bulgaria | 40.7 /100 | #184 | Average 89.6% |
| Immigrants | Brazil | 40.1 /100 | #185 | Average 89.6% |
Demographics Similar to Immigrants from Fiji by 1 or more Vehicles in Household
In terms of 1 or more vehicles in household, the demographic groups most similar to Immigrants from Fiji are Northern European (92.2%, a difference of 0.010%), Nonimmigrants (92.2%, a difference of 0.020%), Choctaw (92.2%, a difference of 0.040%), Spanish (92.3%, a difference of 0.060%), and Immigrants from Taiwan (92.3%, a difference of 0.070%).
| Demographics | Rating | Rank | 1 or more Vehicles in Household |
| Swiss | 99.9 /100 | #39 | Exceptional 92.3% |
| Creek | 99.9 /100 | #40 | Exceptional 92.3% |
| Immigrants | Taiwan | 99.9 /100 | #41 | Exceptional 92.3% |
| Chickasaw | 99.9 /100 | #42 | Exceptional 92.3% |
| Spanish | 99.9 /100 | #43 | Exceptional 92.3% |
| Choctaw | 99.9 /100 | #44 | Exceptional 92.2% |
| Immigrants | Nonimmigrants | 99.9 /100 | #45 | Exceptional 92.2% |
| Immigrants | Fiji | 99.9 /100 | #46 | Exceptional 92.2% |
| Northern Europeans | 99.9 /100 | #47 | Exceptional 92.2% |
| Belgians | 99.9 /100 | #48 | Exceptional 92.1% |
| Afghans | 99.9 /100 | #49 | Exceptional 92.1% |
| Guamanians/Chamorros | 99.9 /100 | #50 | Exceptional 92.1% |
| Celtics | 99.9 /100 | #51 | Exceptional 92.1% |
| Koreans | 99.9 /100 | #52 | Exceptional 92.1% |
| Hawaiians | 99.9 /100 | #53 | Exceptional 92.0% |