Immigrants from Grenada vs Immigrants from Fiji Bachelor's Degree
COMPARE
Immigrants from Grenada
Immigrants from Fiji
Bachelor's Degree
Bachelor's Degree Comparison
Immigrants from Grenada
Immigrants from Fiji
35.0%
BACHELOR'S DEGREE
4.3/ 100
METRIC RATING
230th/ 347
METRIC RANK
33.7%
BACHELOR'S DEGREE
1.2/ 100
METRIC RATING
245th/ 347
METRIC RANK
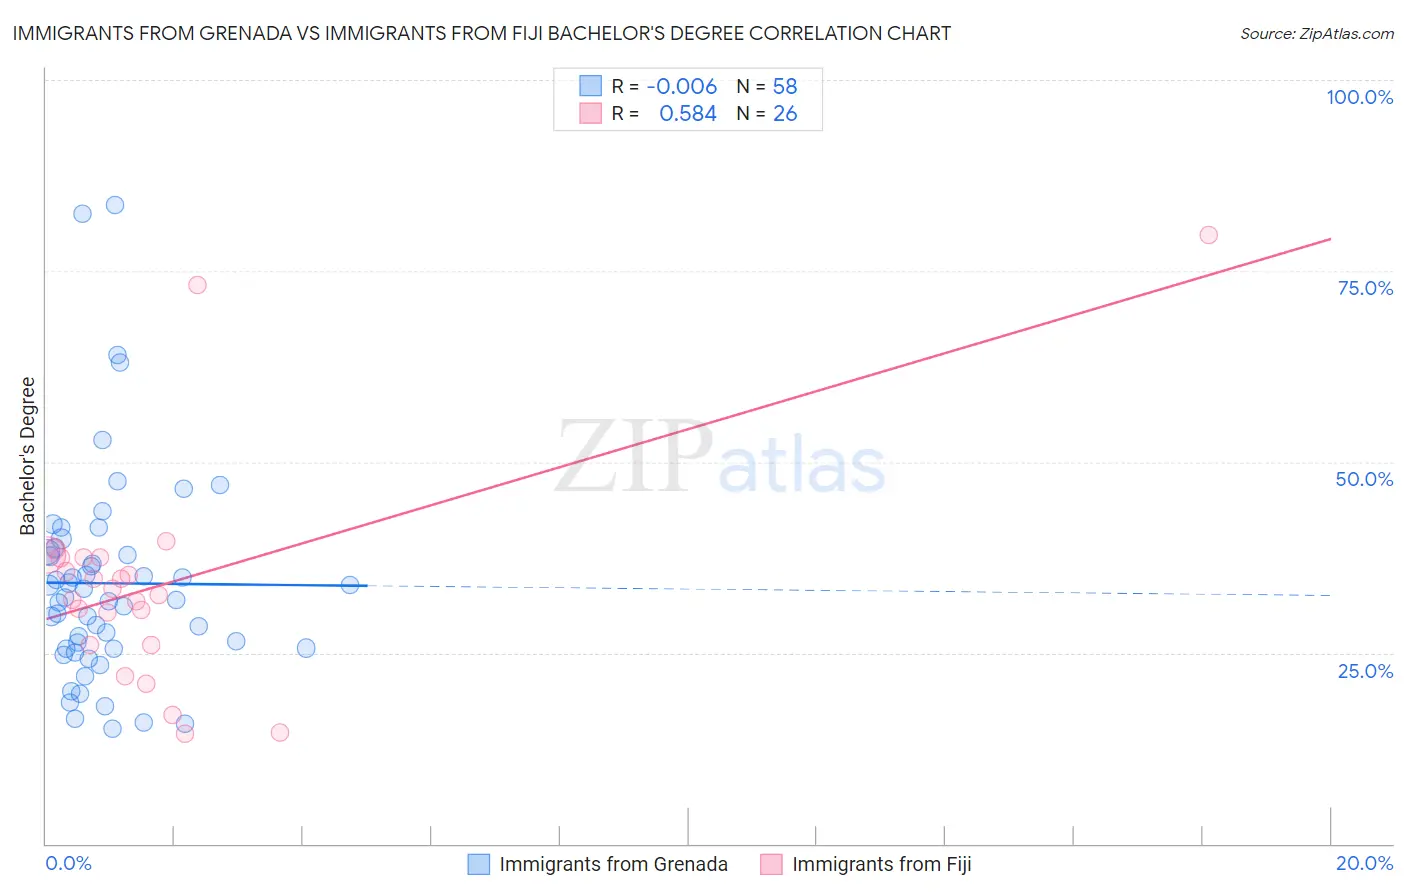
Immigrants from Grenada vs Immigrants from Fiji Bachelor's Degree Correlation Chart
The statistical analysis conducted on geographies consisting of 67,201,096 people shows no correlation between the proportion of Immigrants from Grenada and percentage of population with at least bachelor's degree education in the United States with a correlation coefficient (R) of -0.006 and weighted average of 35.0%. Similarly, the statistical analysis conducted on geographies consisting of 93,755,724 people shows a substantial positive correlation between the proportion of Immigrants from Fiji and percentage of population with at least bachelor's degree education in the United States with a correlation coefficient (R) of 0.584 and weighted average of 33.7%, a difference of 3.7%.
Bachelor's Degree Correlation Summary
| Measurement | Immigrants from Grenada | Immigrants from Fiji |
| Minimum | 15.1% | 14.4% |
| Maximum | 83.6% | 79.8% |
| Range | 68.5% | 65.4% |
| Mean | 34.1% | 34.0% |
| Median | 32.1% | 33.0% |
| Interquartile 25% (IQ1) | 25.5% | 26.1% |
| Interquartile 75% (IQ3) | 38.2% | 37.5% |
| Interquartile Range (IQR) | 12.7% | 11.4% |
| Standard Deviation (Sample) | 14.0% | 14.5% |
| Standard Deviation (Population) | 13.8% | 14.3% |
Demographics Similar to Immigrants from Grenada and Immigrants from Fiji by Bachelor's Degree
In terms of bachelor's degree, the demographic groups most similar to Immigrants from Grenada are Immigrants from St. Vincent and the Grenadines (35.0%, a difference of 0.020%), Hmong (34.8%, a difference of 0.65%), Immigrants from Ecuador (34.7%, a difference of 0.76%), White/Caucasian (35.3%, a difference of 0.84%), and Immigrants from Trinidad and Tobago (35.3%, a difference of 0.93%). Similarly, the demographic groups most similar to Immigrants from Fiji are Delaware (33.8%, a difference of 0.090%), Jamaican (33.6%, a difference of 0.36%), Immigrants from Congo (33.6%, a difference of 0.45%), Immigrants from Guyana (33.9%, a difference of 0.59%), and Nonimmigrants (34.2%, a difference of 1.2%).
| Demographics | Rating | Rank | Bachelor's Degree |
| Ecuadorians | 6.6 /100 | #227 | Tragic 35.4% |
| Immigrants | Trinidad and Tobago | 6.0 /100 | #228 | Tragic 35.3% |
| Whites/Caucasians | 5.9 /100 | #229 | Tragic 35.3% |
| Immigrants | Grenada | 4.3 /100 | #230 | Tragic 35.0% |
| Immigrants | St. Vincent and the Grenadines | 4.3 /100 | #231 | Tragic 35.0% |
| Hmong | 3.4 /100 | #232 | Tragic 34.8% |
| Immigrants | Ecuador | 3.3 /100 | #233 | Tragic 34.7% |
| Guamanians/Chamorros | 3.0 /100 | #234 | Tragic 34.6% |
| Immigrants | West Indies | 2.9 /100 | #235 | Tragic 34.6% |
| Liberians | 2.8 /100 | #236 | Tragic 34.6% |
| Tlingit-Haida | 2.8 /100 | #237 | Tragic 34.6% |
| Guyanese | 2.5 /100 | #238 | Tragic 34.5% |
| British West Indians | 2.5 /100 | #239 | Tragic 34.5% |
| Tongans | 2.0 /100 | #240 | Tragic 34.3% |
| Immigrants | Cambodia | 1.9 /100 | #241 | Tragic 34.2% |
| Immigrants | Nonimmigrants | 1.8 /100 | #242 | Tragic 34.2% |
| Immigrants | Guyana | 1.4 /100 | #243 | Tragic 33.9% |
| Delaware | 1.2 /100 | #244 | Tragic 33.8% |
| Immigrants | Fiji | 1.2 /100 | #245 | Tragic 33.7% |
| Jamaicans | 1.0 /100 | #246 | Tragic 33.6% |
| Immigrants | Congo | 1.0 /100 | #247 | Tragic 33.6% |