Immigrants from El Salvador vs Creek Bachelor's Degree
COMPARE
Immigrants from El Salvador
Creek
Bachelor's Degree
Bachelor's Degree Comparison
Immigrants from El Salvador
Creek
31.3%
BACHELOR'S DEGREE
0.1/ 100
METRIC RATING
286th/ 347
METRIC RANK
28.9%
BACHELOR'S DEGREE
0.0/ 100
METRIC RATING
319th/ 347
METRIC RANK
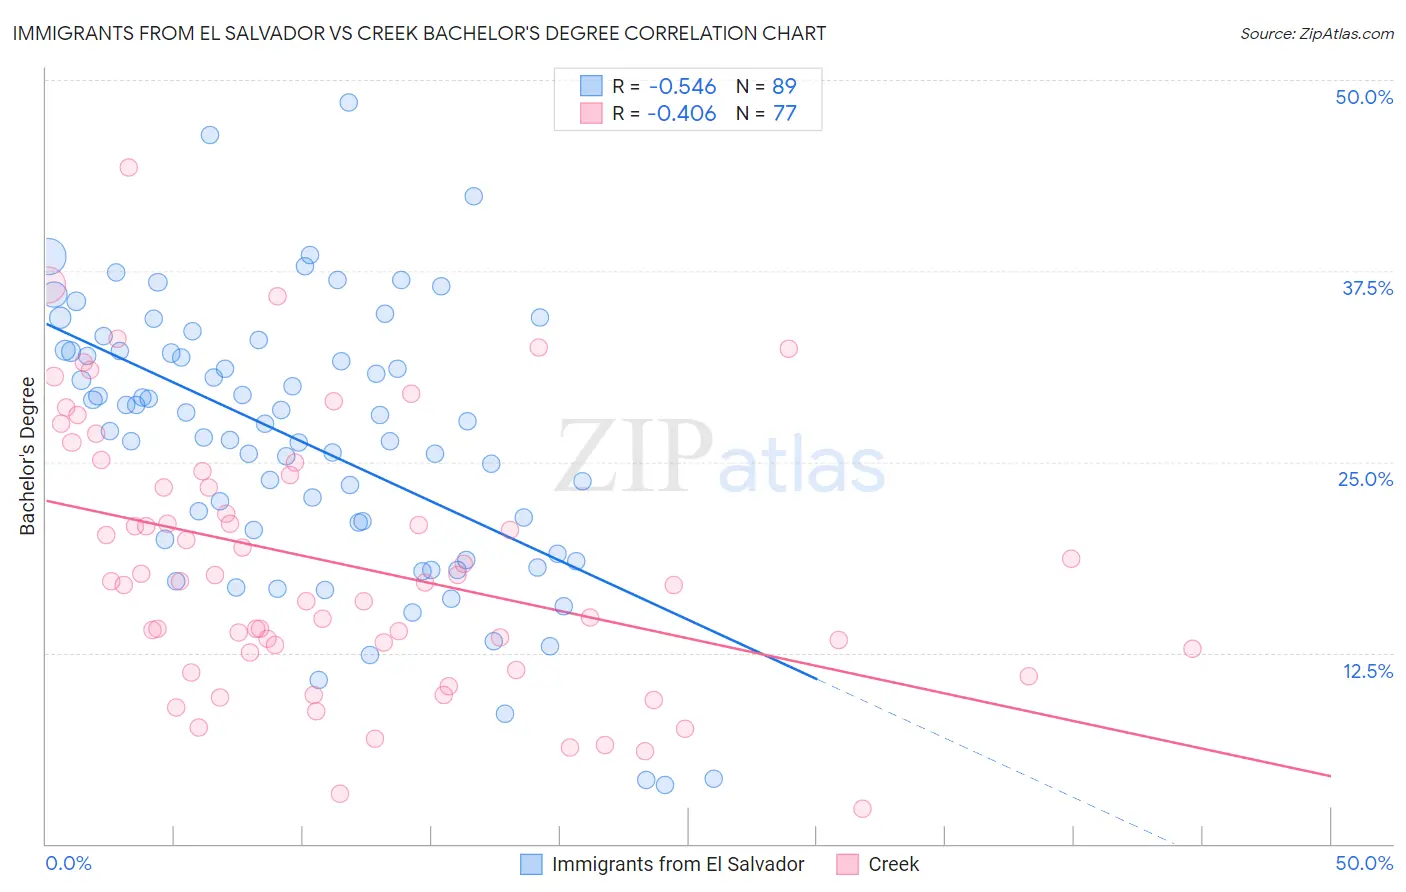
Immigrants from El Salvador vs Creek Bachelor's Degree Correlation Chart
The statistical analysis conducted on geographies consisting of 357,832,054 people shows a substantial negative correlation between the proportion of Immigrants from El Salvador and percentage of population with at least bachelor's degree education in the United States with a correlation coefficient (R) of -0.546 and weighted average of 31.3%. Similarly, the statistical analysis conducted on geographies consisting of 178,478,956 people shows a moderate negative correlation between the proportion of Creek and percentage of population with at least bachelor's degree education in the United States with a correlation coefficient (R) of -0.406 and weighted average of 28.9%, a difference of 8.5%.
Bachelor's Degree Correlation Summary
| Measurement | Immigrants from El Salvador | Creek |
| Minimum | 3.9% | 2.3% |
| Maximum | 48.5% | 44.3% |
| Range | 44.6% | 42.0% |
| Mean | 26.3% | 18.4% |
| Median | 27.5% | 17.1% |
| Interquartile 25% (IQ1) | 19.4% | 12.7% |
| Interquartile 75% (IQ3) | 32.2% | 24.3% |
| Interquartile Range (IQR) | 12.8% | 11.6% |
| Standard Deviation (Sample) | 9.0% | 8.6% |
| Standard Deviation (Population) | 8.9% | 8.6% |
Similar Demographics by Bachelor's Degree
Demographics Similar to Immigrants from El Salvador by Bachelor's Degree
In terms of bachelor's degree, the demographic groups most similar to Immigrants from El Salvador are Aleut (31.3%, a difference of 0.050%), Haitian (31.3%, a difference of 0.070%), Honduran (31.3%, a difference of 0.10%), Immigrants from Caribbean (31.4%, a difference of 0.38%), and Blackfeet (31.5%, a difference of 0.52%).
| Demographics | Rating | Rank | Bachelor's Degree |
| Hawaiians | 0.1 /100 | #279 | Tragic 31.6% |
| Immigrants | Laos | 0.1 /100 | #280 | Tragic 31.6% |
| Blackfeet | 0.1 /100 | #281 | Tragic 31.5% |
| Immigrants | Caribbean | 0.1 /100 | #282 | Tragic 31.4% |
| Hondurans | 0.1 /100 | #283 | Tragic 31.3% |
| Haitians | 0.1 /100 | #284 | Tragic 31.3% |
| Aleuts | 0.1 /100 | #285 | Tragic 31.3% |
| Immigrants | El Salvador | 0.1 /100 | #286 | Tragic 31.3% |
| Ottawa | 0.1 /100 | #287 | Tragic 31.1% |
| Guatemalans | 0.1 /100 | #288 | Tragic 31.0% |
| Puerto Ricans | 0.1 /100 | #289 | Tragic 31.0% |
| Immigrants | Honduras | 0.1 /100 | #290 | Tragic 30.9% |
| Blacks/African Americans | 0.1 /100 | #291 | Tragic 30.9% |
| Ute | 0.1 /100 | #292 | Tragic 30.9% |
| Cape Verdeans | 0.1 /100 | #293 | Tragic 30.9% |
Demographics Similar to Creek by Bachelor's Degree
In terms of bachelor's degree, the demographic groups most similar to Creek are Kiowa (28.8%, a difference of 0.040%), Alaskan Athabascan (28.8%, a difference of 0.13%), Tsimshian (28.8%, a difference of 0.35%), Yaqui (29.0%, a difference of 0.45%), and Fijian (28.7%, a difference of 0.48%).
| Demographics | Rating | Rank | Bachelor's Degree |
| Seminole | 0.0 /100 | #312 | Tragic 29.4% |
| Alaska Natives | 0.0 /100 | #313 | Tragic 29.4% |
| Shoshone | 0.0 /100 | #314 | Tragic 29.3% |
| Immigrants | Cabo Verde | 0.0 /100 | #315 | Tragic 29.2% |
| Sioux | 0.0 /100 | #316 | Tragic 29.1% |
| Colville | 0.0 /100 | #317 | Tragic 29.0% |
| Yaqui | 0.0 /100 | #318 | Tragic 29.0% |
| Creek | 0.0 /100 | #319 | Tragic 28.9% |
| Kiowa | 0.0 /100 | #320 | Tragic 28.8% |
| Alaskan Athabascans | 0.0 /100 | #321 | Tragic 28.8% |
| Tsimshian | 0.0 /100 | #322 | Tragic 28.8% |
| Fijians | 0.0 /100 | #323 | Tragic 28.7% |
| Dutch West Indians | 0.0 /100 | #324 | Tragic 28.5% |
| Pennsylvania Germans | 0.0 /100 | #325 | Tragic 28.4% |
| Apache | 0.0 /100 | #326 | Tragic 28.3% |