Immigrants from Central America vs Immigrants from Fiji Bachelor's Degree
COMPARE
Immigrants from Central America
Immigrants from Fiji
Bachelor's Degree
Bachelor's Degree Comparison
Immigrants from Central America
Immigrants from Fiji
27.5%
BACHELOR'S DEGREE
0.0/ 100
METRIC RATING
329th/ 347
METRIC RANK
33.7%
BACHELOR'S DEGREE
1.2/ 100
METRIC RATING
245th/ 347
METRIC RANK
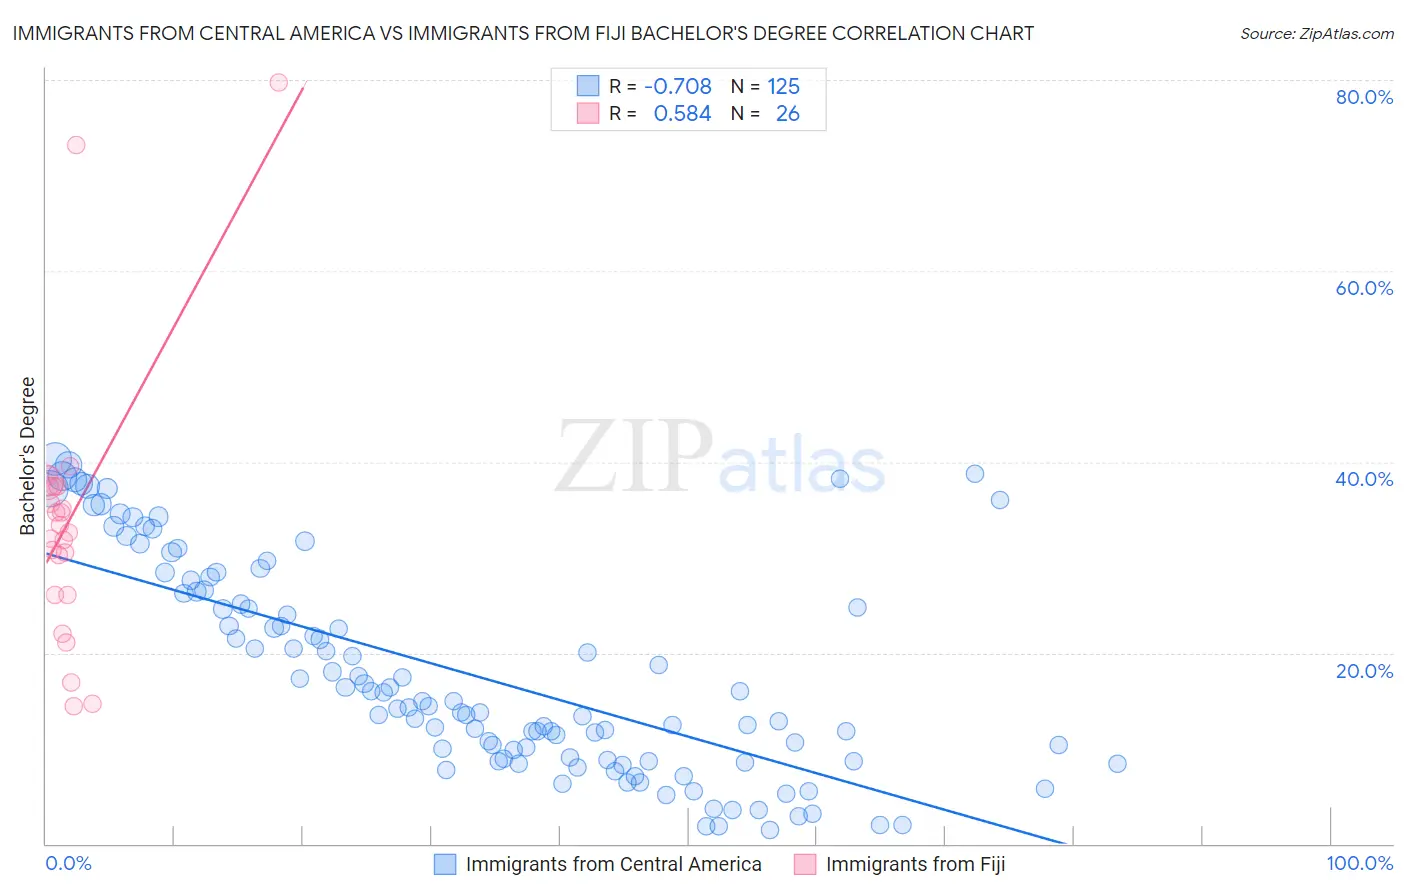
Immigrants from Central America vs Immigrants from Fiji Bachelor's Degree Correlation Chart
The statistical analysis conducted on geographies consisting of 536,401,370 people shows a strong negative correlation between the proportion of Immigrants from Central America and percentage of population with at least bachelor's degree education in the United States with a correlation coefficient (R) of -0.708 and weighted average of 27.5%. Similarly, the statistical analysis conducted on geographies consisting of 93,755,724 people shows a substantial positive correlation between the proportion of Immigrants from Fiji and percentage of population with at least bachelor's degree education in the United States with a correlation coefficient (R) of 0.584 and weighted average of 33.7%, a difference of 22.8%.
Bachelor's Degree Correlation Summary
| Measurement | Immigrants from Central America | Immigrants from Fiji |
| Minimum | 1.4% | 14.4% |
| Maximum | 40.3% | 79.8% |
| Range | 38.8% | 65.4% |
| Mean | 17.9% | 34.0% |
| Median | 14.9% | 33.0% |
| Interquartile 25% (IQ1) | 8.9% | 26.1% |
| Interquartile 75% (IQ3) | 26.5% | 37.5% |
| Interquartile Range (IQR) | 17.6% | 11.4% |
| Standard Deviation (Sample) | 10.9% | 14.5% |
| Standard Deviation (Population) | 10.9% | 14.3% |
Similar Demographics by Bachelor's Degree
Demographics Similar to Immigrants from Central America by Bachelor's Degree
In terms of bachelor's degree, the demographic groups most similar to Immigrants from Central America are Spanish American Indian (27.5%, a difference of 0.060%), Immigrants from the Azores (27.3%, a difference of 0.54%), Menominee (27.3%, a difference of 0.64%), Crow (27.7%, a difference of 1.0%), and Mexican (27.1%, a difference of 1.5%).
| Demographics | Rating | Rank | Bachelor's Degree |
| Tsimshian | 0.0 /100 | #322 | Tragic 28.8% |
| Fijians | 0.0 /100 | #323 | Tragic 28.7% |
| Dutch West Indians | 0.0 /100 | #324 | Tragic 28.5% |
| Pennsylvania Germans | 0.0 /100 | #325 | Tragic 28.4% |
| Apache | 0.0 /100 | #326 | Tragic 28.3% |
| Paiute | 0.0 /100 | #327 | Tragic 28.1% |
| Crow | 0.0 /100 | #328 | Tragic 27.7% |
| Immigrants | Central America | 0.0 /100 | #329 | Tragic 27.5% |
| Spanish American Indians | 0.0 /100 | #330 | Tragic 27.5% |
| Immigrants | Azores | 0.0 /100 | #331 | Tragic 27.3% |
| Menominee | 0.0 /100 | #332 | Tragic 27.3% |
| Mexicans | 0.0 /100 | #333 | Tragic 27.1% |
| Arapaho | 0.0 /100 | #334 | Tragic 26.6% |
| Natives/Alaskans | 0.0 /100 | #335 | Tragic 26.3% |
| Immigrants | Mexico | 0.0 /100 | #336 | Tragic 26.1% |
Demographics Similar to Immigrants from Fiji by Bachelor's Degree
In terms of bachelor's degree, the demographic groups most similar to Immigrants from Fiji are Delaware (33.8%, a difference of 0.090%), Jamaican (33.6%, a difference of 0.36%), Immigrants from Congo (33.6%, a difference of 0.45%), Cree (33.6%, a difference of 0.47%), and Immigrants from Guyana (33.9%, a difference of 0.59%).
| Demographics | Rating | Rank | Bachelor's Degree |
| Guyanese | 2.5 /100 | #238 | Tragic 34.5% |
| British West Indians | 2.5 /100 | #239 | Tragic 34.5% |
| Tongans | 2.0 /100 | #240 | Tragic 34.3% |
| Immigrants | Cambodia | 1.9 /100 | #241 | Tragic 34.2% |
| Immigrants | Nonimmigrants | 1.8 /100 | #242 | Tragic 34.2% |
| Immigrants | Guyana | 1.4 /100 | #243 | Tragic 33.9% |
| Delaware | 1.2 /100 | #244 | Tragic 33.8% |
| Immigrants | Fiji | 1.2 /100 | #245 | Tragic 33.7% |
| Jamaicans | 1.0 /100 | #246 | Tragic 33.6% |
| Immigrants | Congo | 1.0 /100 | #247 | Tragic 33.6% |
| Cree | 1.0 /100 | #248 | Tragic 33.6% |
| Immigrants | Liberia | 0.9 /100 | #249 | Tragic 33.5% |
| Indonesians | 0.9 /100 | #250 | Tragic 33.5% |
| Japanese | 0.7 /100 | #251 | Tragic 33.3% |
| Immigrants | Bahamas | 0.7 /100 | #252 | Tragic 33.3% |