Immigrants from El Salvador vs Immigrants from Fiji Professional Degree
COMPARE
Immigrants from El Salvador
Immigrants from Fiji
Professional Degree
Professional Degree Comparison
Immigrants from El Salvador
Immigrants from Fiji
3.5%
PROFESSIONAL DEGREE
0.3/ 100
METRIC RATING
287th/ 347
METRIC RANK
3.7%
PROFESSIONAL DEGREE
1.5/ 100
METRIC RATING
250th/ 347
METRIC RANK
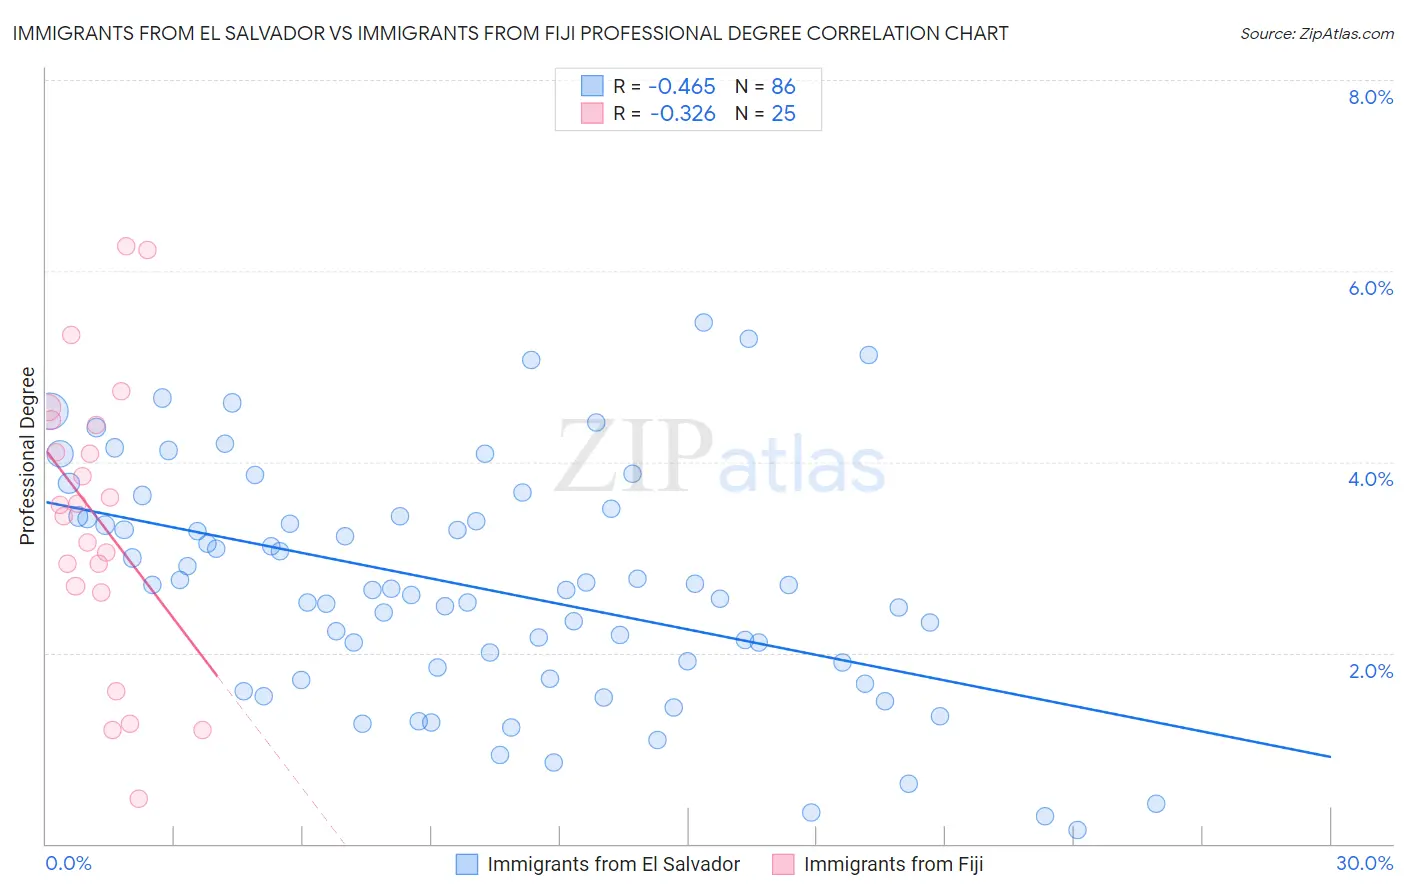
Immigrants from El Salvador vs Immigrants from Fiji Professional Degree Correlation Chart
The statistical analysis conducted on geographies consisting of 356,542,562 people shows a moderate negative correlation between the proportion of Immigrants from El Salvador and percentage of population with at least professional degree education in the United States with a correlation coefficient (R) of -0.465 and weighted average of 3.5%. Similarly, the statistical analysis conducted on geographies consisting of 93,709,479 people shows a mild negative correlation between the proportion of Immigrants from Fiji and percentage of population with at least professional degree education in the United States with a correlation coefficient (R) of -0.326 and weighted average of 3.7%, a difference of 7.6%.
Professional Degree Correlation Summary
| Measurement | Immigrants from El Salvador | Immigrants from Fiji |
| Minimum | 0.14% | 0.47% |
| Maximum | 5.5% | 6.3% |
| Range | 5.3% | 5.8% |
| Mean | 2.7% | 3.4% |
| Median | 2.7% | 3.5% |
| Interquartile 25% (IQ1) | 1.8% | 2.7% |
| Interquartile 75% (IQ3) | 3.4% | 4.4% |
| Interquartile Range (IQR) | 1.6% | 1.7% |
| Standard Deviation (Sample) | 1.2% | 1.5% |
| Standard Deviation (Population) | 1.2% | 1.5% |
Similar Demographics by Professional Degree
Demographics Similar to Immigrants from El Salvador by Professional Degree
In terms of professional degree, the demographic groups most similar to Immigrants from El Salvador are Blackfeet (3.5%, a difference of 0.050%), Haitian (3.5%, a difference of 0.10%), Guatemalan (3.5%, a difference of 0.22%), Chippewa (3.5%, a difference of 0.23%), and Alaska Native (3.5%, a difference of 0.41%).
| Demographics | Rating | Rank | Professional Degree |
| Dominicans | 0.5 /100 | #280 | Tragic 3.5% |
| Apache | 0.5 /100 | #281 | Tragic 3.5% |
| Immigrants | Caribbean | 0.5 /100 | #282 | Tragic 3.5% |
| Comanche | 0.4 /100 | #283 | Tragic 3.5% |
| Salvadorans | 0.4 /100 | #284 | Tragic 3.5% |
| Hondurans | 0.3 /100 | #285 | Tragic 3.5% |
| Haitians | 0.3 /100 | #286 | Tragic 3.5% |
| Immigrants | El Salvador | 0.3 /100 | #287 | Tragic 3.5% |
| Blackfeet | 0.3 /100 | #288 | Tragic 3.5% |
| Guatemalans | 0.3 /100 | #289 | Tragic 3.5% |
| Chippewa | 0.3 /100 | #290 | Tragic 3.5% |
| Alaska Natives | 0.3 /100 | #291 | Tragic 3.5% |
| Immigrants | Belize | 0.3 /100 | #292 | Tragic 3.5% |
| Immigrants | Honduras | 0.3 /100 | #293 | Tragic 3.5% |
| Paiute | 0.3 /100 | #294 | Tragic 3.4% |
Demographics Similar to Immigrants from Fiji by Professional Degree
In terms of professional degree, the demographic groups most similar to Immigrants from Fiji are Immigrants from Grenada (3.7%, a difference of 0.060%), Hmong (3.7%, a difference of 0.18%), Immigrants from Nicaragua (3.7%, a difference of 0.25%), Guyanese (3.8%, a difference of 0.34%), and Marshallese (3.8%, a difference of 0.36%).
| Demographics | Rating | Rank | Professional Degree |
| Guamanians/Chamorros | 2.2 /100 | #243 | Tragic 3.8% |
| Immigrants | Bahamas | 2.0 /100 | #244 | Tragic 3.8% |
| French American Indians | 1.7 /100 | #245 | Tragic 3.8% |
| Marshallese | 1.7 /100 | #246 | Tragic 3.8% |
| Guyanese | 1.6 /100 | #247 | Tragic 3.8% |
| Hmong | 1.6 /100 | #248 | Tragic 3.7% |
| Immigrants | Grenada | 1.5 /100 | #249 | Tragic 3.7% |
| Immigrants | Fiji | 1.5 /100 | #250 | Tragic 3.7% |
| Immigrants | Nicaragua | 1.4 /100 | #251 | Tragic 3.7% |
| Jamaicans | 1.4 /100 | #252 | Tragic 3.7% |
| Pueblo | 1.4 /100 | #253 | Tragic 3.7% |
| Tongans | 1.3 /100 | #254 | Tragic 3.7% |
| Osage | 1.2 /100 | #255 | Tragic 3.7% |
| Iroquois | 1.2 /100 | #256 | Tragic 3.7% |
| Bahamians | 1.1 /100 | #257 | Tragic 3.7% |