Immigrants from El Salvador vs Korean Bachelor's Degree
COMPARE
Immigrants from El Salvador
Korean
Bachelor's Degree
Bachelor's Degree Comparison
Immigrants from El Salvador
Koreans
31.3%
BACHELOR'S DEGREE
0.1/ 100
METRIC RATING
286th/ 347
METRIC RANK
37.0%
BACHELOR'S DEGREE
29.8/ 100
METRIC RATING
195th/ 347
METRIC RANK
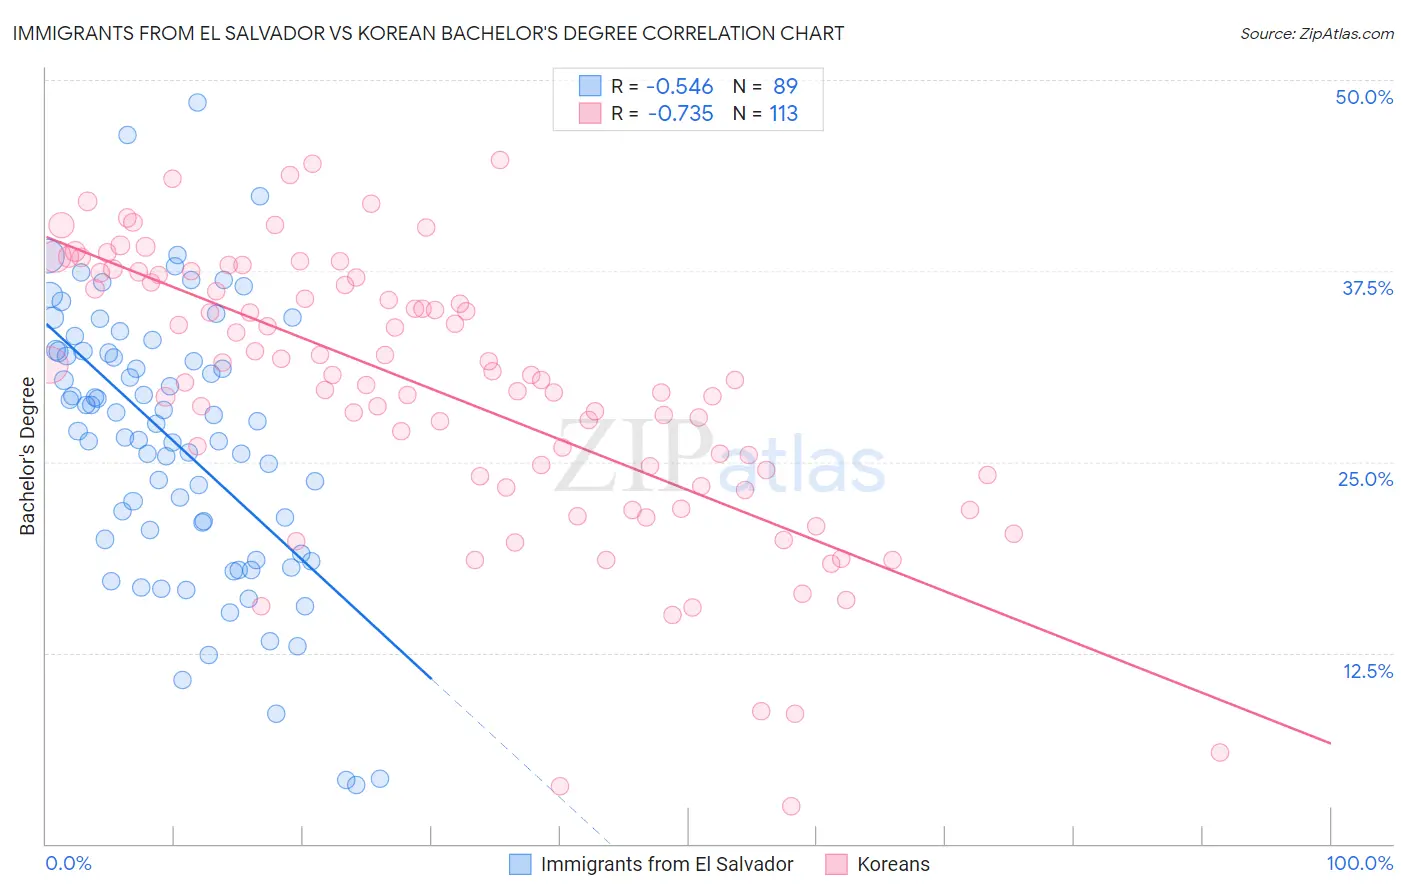
Immigrants from El Salvador vs Korean Bachelor's Degree Correlation Chart
The statistical analysis conducted on geographies consisting of 357,832,054 people shows a substantial negative correlation between the proportion of Immigrants from El Salvador and percentage of population with at least bachelor's degree education in the United States with a correlation coefficient (R) of -0.546 and weighted average of 31.3%. Similarly, the statistical analysis conducted on geographies consisting of 510,872,242 people shows a strong negative correlation between the proportion of Koreans and percentage of population with at least bachelor's degree education in the United States with a correlation coefficient (R) of -0.735 and weighted average of 37.0%, a difference of 18.3%.
Bachelor's Degree Correlation Summary
| Measurement | Immigrants from El Salvador | Korean |
| Minimum | 3.9% | 2.5% |
| Maximum | 48.5% | 44.8% |
| Range | 44.6% | 42.3% |
| Mean | 26.3% | 29.6% |
| Median | 27.5% | 30.4% |
| Interquartile 25% (IQ1) | 19.4% | 23.7% |
| Interquartile 75% (IQ3) | 32.2% | 36.9% |
| Interquartile Range (IQR) | 12.8% | 13.2% |
| Standard Deviation (Sample) | 9.0% | 9.0% |
| Standard Deviation (Population) | 8.9% | 9.0% |
Similar Demographics by Bachelor's Degree
Demographics Similar to Immigrants from El Salvador by Bachelor's Degree
In terms of bachelor's degree, the demographic groups most similar to Immigrants from El Salvador are Aleut (31.3%, a difference of 0.050%), Haitian (31.3%, a difference of 0.070%), Honduran (31.3%, a difference of 0.10%), Immigrants from Caribbean (31.4%, a difference of 0.38%), and Blackfeet (31.5%, a difference of 0.52%).
| Demographics | Rating | Rank | Bachelor's Degree |
| Hawaiians | 0.1 /100 | #279 | Tragic 31.6% |
| Immigrants | Laos | 0.1 /100 | #280 | Tragic 31.6% |
| Blackfeet | 0.1 /100 | #281 | Tragic 31.5% |
| Immigrants | Caribbean | 0.1 /100 | #282 | Tragic 31.4% |
| Hondurans | 0.1 /100 | #283 | Tragic 31.3% |
| Haitians | 0.1 /100 | #284 | Tragic 31.3% |
| Aleuts | 0.1 /100 | #285 | Tragic 31.3% |
| Immigrants | El Salvador | 0.1 /100 | #286 | Tragic 31.3% |
| Ottawa | 0.1 /100 | #287 | Tragic 31.1% |
| Guatemalans | 0.1 /100 | #288 | Tragic 31.0% |
| Puerto Ricans | 0.1 /100 | #289 | Tragic 31.0% |
| Immigrants | Honduras | 0.1 /100 | #290 | Tragic 30.9% |
| Blacks/African Americans | 0.1 /100 | #291 | Tragic 30.9% |
| Ute | 0.1 /100 | #292 | Tragic 30.9% |
| Cape Verdeans | 0.1 /100 | #293 | Tragic 30.9% |
Demographics Similar to Koreans by Bachelor's Degree
In terms of bachelor's degree, the demographic groups most similar to Koreans are Belgian (37.0%, a difference of 0.010%), Celtic (37.0%, a difference of 0.030%), Czechoslovakian (37.0%, a difference of 0.070%), Welsh (37.0%, a difference of 0.080%), and Yugoslavian (37.1%, a difference of 0.20%).
| Demographics | Rating | Rank | Bachelor's Degree |
| Immigrants | Oceania | 37.3 /100 | #188 | Fair 37.3% |
| Slovaks | 36.9 /100 | #189 | Fair 37.3% |
| Swiss | 34.1 /100 | #190 | Fair 37.2% |
| Nigerians | 33.9 /100 | #191 | Fair 37.2% |
| Immigrants | Vietnam | 32.1 /100 | #192 | Fair 37.1% |
| Yugoslavians | 31.5 /100 | #193 | Fair 37.1% |
| Belgians | 29.9 /100 | #194 | Fair 37.0% |
| Koreans | 29.8 /100 | #195 | Fair 37.0% |
| Celtics | 29.5 /100 | #196 | Fair 37.0% |
| Czechoslovakians | 29.2 /100 | #197 | Fair 37.0% |
| Welsh | 29.1 /100 | #198 | Fair 37.0% |
| Immigrants | Costa Rica | 27.4 /100 | #199 | Fair 36.9% |
| Immigrants | Ghana | 27.4 /100 | #200 | Fair 36.9% |
| Immigrants | South Eastern Asia | 25.4 /100 | #201 | Fair 36.8% |
| Immigrants | Zaire | 25.3 /100 | #202 | Fair 36.8% |