Immigrants from Dominica vs Immigrants from Micronesia GED/Equivalency
COMPARE
Immigrants from Dominica
Immigrants from Micronesia
GED/Equivalency
GED/Equivalency Comparison
Immigrants from Dominica
Immigrants from Micronesia
81.1%
GED/EQUIVALENCY
0.0/ 100
METRIC RATING
307th/ 347
METRIC RANK
84.7%
GED/EQUIVALENCY
8.7/ 100
METRIC RATING
216th/ 347
METRIC RANK
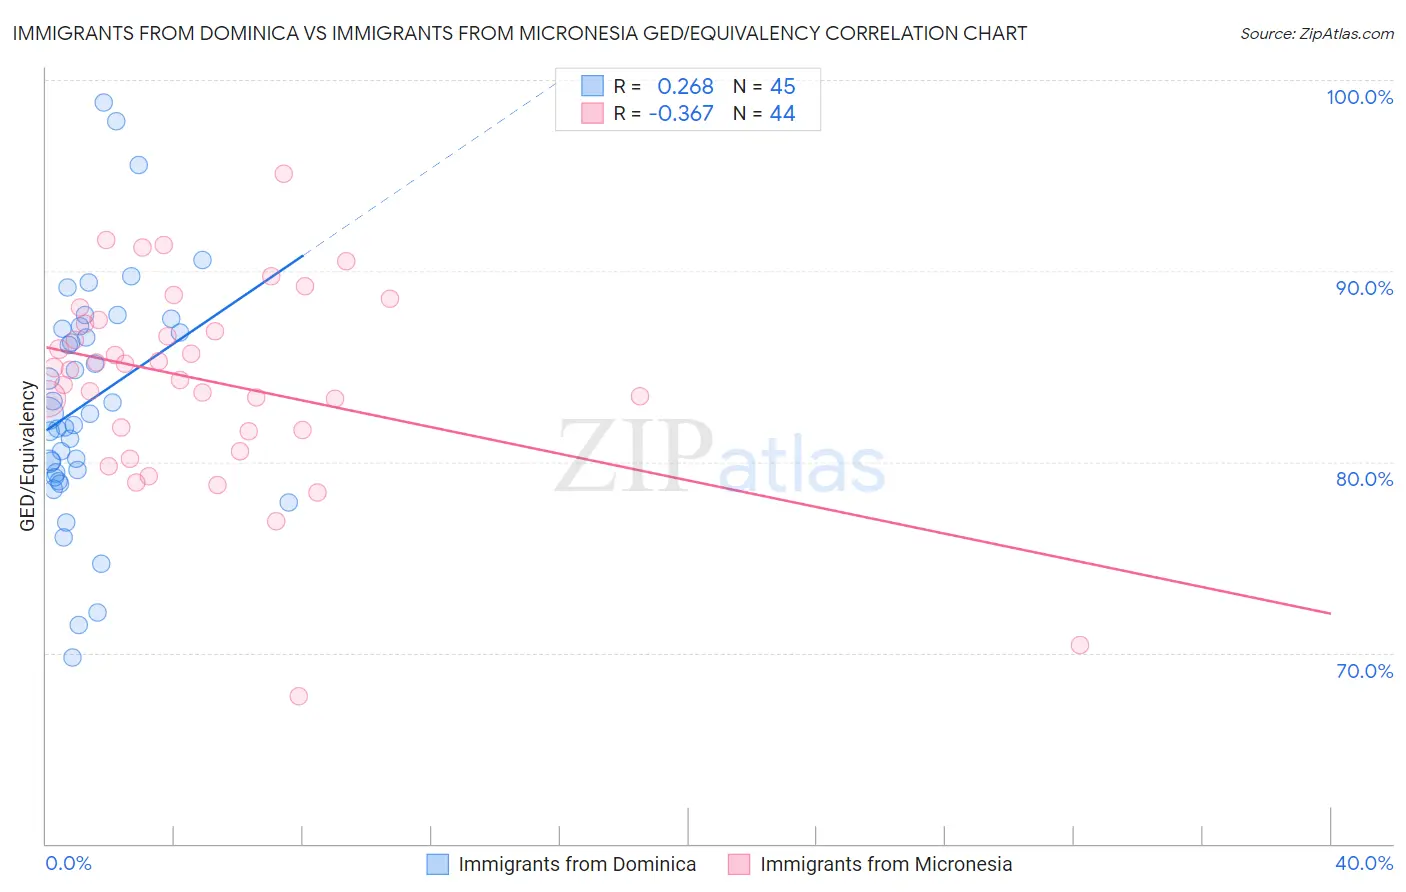
Immigrants from Dominica vs Immigrants from Micronesia GED/Equivalency Correlation Chart
The statistical analysis conducted on geographies consisting of 83,794,115 people shows a weak positive correlation between the proportion of Immigrants from Dominica and percentage of population with at least ged/equivalency education in the United States with a correlation coefficient (R) of 0.268 and weighted average of 81.1%. Similarly, the statistical analysis conducted on geographies consisting of 61,609,499 people shows a mild negative correlation between the proportion of Immigrants from Micronesia and percentage of population with at least ged/equivalency education in the United States with a correlation coefficient (R) of -0.367 and weighted average of 84.7%, a difference of 4.4%.
GED/Equivalency Correlation Summary
| Measurement | Immigrants from Dominica | Immigrants from Micronesia |
| Minimum | 69.7% | 67.7% |
| Maximum | 98.8% | 95.1% |
| Range | 29.1% | 27.3% |
| Mean | 83.1% | 84.2% |
| Median | 82.5% | 84.9% |
| Interquartile 25% (IQ1) | 79.3% | 81.6% |
| Interquartile 75% (IQ3) | 87.0% | 87.3% |
| Interquartile Range (IQR) | 7.8% | 5.7% |
| Standard Deviation (Sample) | 6.2% | 5.2% |
| Standard Deviation (Population) | 6.2% | 5.2% |
Similar Demographics by GED/Equivalency
Demographics Similar to Immigrants from Dominica by GED/Equivalency
In terms of ged/equivalency, the demographic groups most similar to Immigrants from Dominica are Puerto Rican (81.1%, a difference of 0.10%), Guyanese (81.3%, a difference of 0.17%), Immigrants from Ecuador (81.0%, a difference of 0.18%), Immigrants from Grenada (81.3%, a difference of 0.19%), and Immigrants from Guyana (81.0%, a difference of 0.25%).
| Demographics | Rating | Rank | GED/Equivalency |
| Fijians | 0.0 /100 | #300 | Tragic 81.6% |
| Dutch West Indians | 0.0 /100 | #301 | Tragic 81.6% |
| Immigrants | Haiti | 0.0 /100 | #302 | Tragic 81.6% |
| Immigrants | Portugal | 0.0 /100 | #303 | Tragic 81.6% |
| Navajo | 0.0 /100 | #304 | Tragic 81.5% |
| Immigrants | Grenada | 0.0 /100 | #305 | Tragic 81.3% |
| Guyanese | 0.0 /100 | #306 | Tragic 81.3% |
| Immigrants | Dominica | 0.0 /100 | #307 | Tragic 81.1% |
| Puerto Ricans | 0.0 /100 | #308 | Tragic 81.1% |
| Immigrants | Ecuador | 0.0 /100 | #309 | Tragic 81.0% |
| Immigrants | Guyana | 0.0 /100 | #310 | Tragic 81.0% |
| Natives/Alaskans | 0.0 /100 | #311 | Tragic 80.9% |
| Nicaraguans | 0.0 /100 | #312 | Tragic 80.9% |
| Cape Verdeans | 0.0 /100 | #313 | Tragic 80.9% |
| Belizeans | 0.0 /100 | #314 | Tragic 80.9% |
Demographics Similar to Immigrants from Micronesia by GED/Equivalency
In terms of ged/equivalency, the demographic groups most similar to Immigrants from Micronesia are Nigerian (84.7%, a difference of 0.0%), Alaska Native (84.7%, a difference of 0.0%), Peruvian (84.7%, a difference of 0.030%), Potawatomi (84.7%, a difference of 0.030%), and American (84.7%, a difference of 0.030%).
| Demographics | Rating | Rank | GED/Equivalency |
| Colombians | 12.3 /100 | #209 | Poor 84.9% |
| Immigrants | Cameroon | 12.1 /100 | #210 | Poor 84.9% |
| South Americans | 10.9 /100 | #211 | Poor 84.8% |
| Immigrants | Somalia | 10.6 /100 | #212 | Poor 84.8% |
| Immigrants | Philippines | 10.0 /100 | #213 | Poor 84.8% |
| Osage | 9.5 /100 | #214 | Tragic 84.8% |
| Peruvians | 9.2 /100 | #215 | Tragic 84.7% |
| Immigrants | Micronesia | 8.7 /100 | #216 | Tragic 84.7% |
| Nigerians | 8.6 /100 | #217 | Tragic 84.7% |
| Alaska Natives | 8.6 /100 | #218 | Tragic 84.7% |
| Potawatomi | 8.2 /100 | #219 | Tragic 84.7% |
| Americans | 8.2 /100 | #220 | Tragic 84.7% |
| Taiwanese | 8.1 /100 | #221 | Tragic 84.7% |
| Iroquois | 7.5 /100 | #222 | Tragic 84.6% |
| Immigrants | Uzbekistan | 7.1 /100 | #223 | Tragic 84.6% |