Immigrants from Bahamas vs Immigrants from Micronesia GED/Equivalency
COMPARE
Immigrants from Bahamas
Immigrants from Micronesia
GED/Equivalency
GED/Equivalency Comparison
Immigrants from Bahamas
Immigrants from Micronesia
84.2%
GED/EQUIVALENCY
2.6/ 100
METRIC RATING
239th/ 347
METRIC RANK
84.7%
GED/EQUIVALENCY
8.7/ 100
METRIC RATING
216th/ 347
METRIC RANK
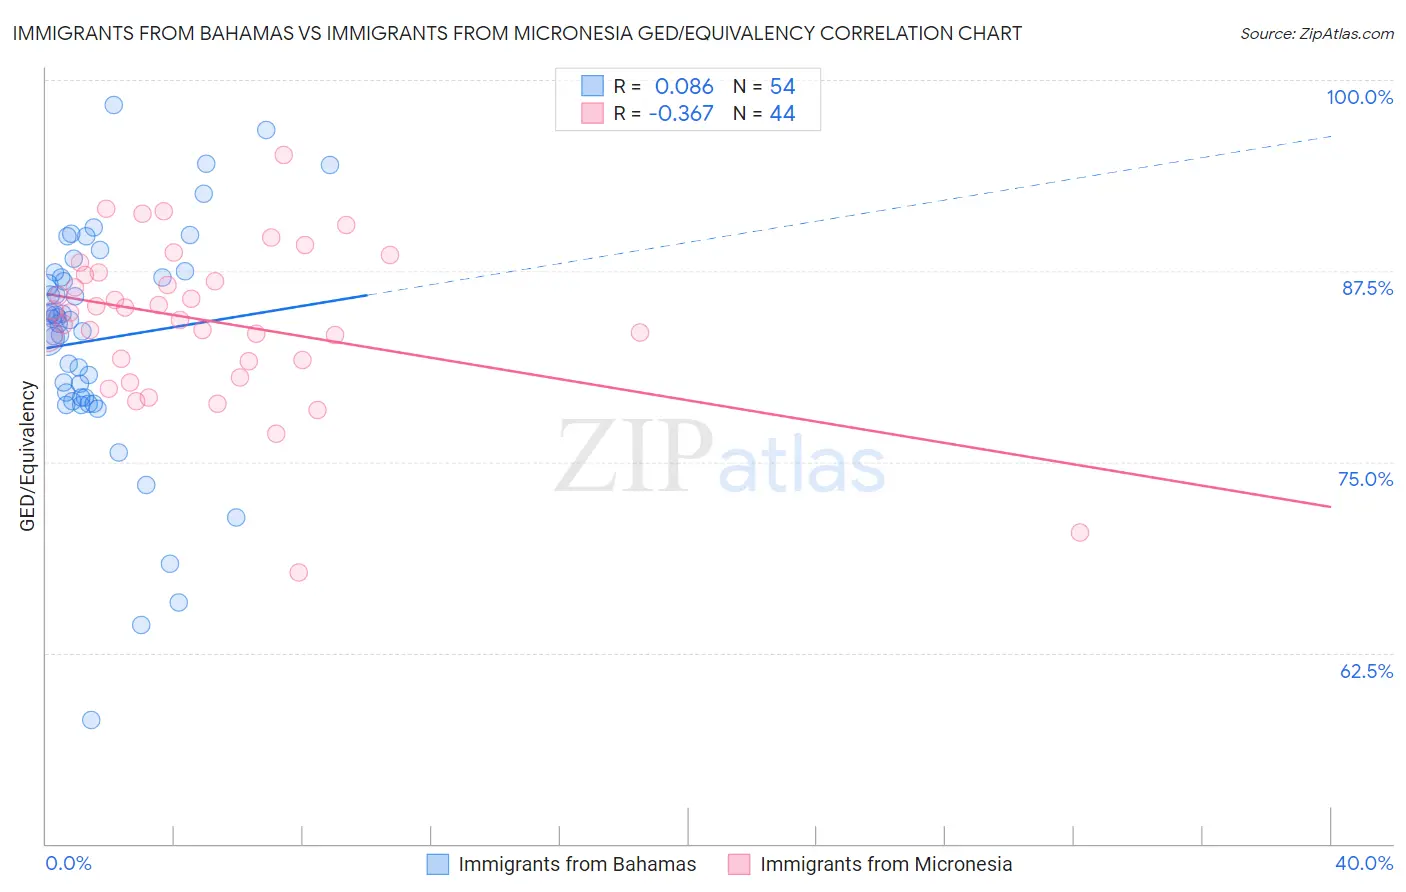
Immigrants from Bahamas vs Immigrants from Micronesia GED/Equivalency Correlation Chart
The statistical analysis conducted on geographies consisting of 104,666,801 people shows a slight positive correlation between the proportion of Immigrants from Bahamas and percentage of population with at least ged/equivalency education in the United States with a correlation coefficient (R) of 0.086 and weighted average of 84.2%. Similarly, the statistical analysis conducted on geographies consisting of 61,609,499 people shows a mild negative correlation between the proportion of Immigrants from Micronesia and percentage of population with at least ged/equivalency education in the United States with a correlation coefficient (R) of -0.367 and weighted average of 84.7%, a difference of 0.67%.
GED/Equivalency Correlation Summary
| Measurement | Immigrants from Bahamas | Immigrants from Micronesia |
| Minimum | 58.1% | 67.7% |
| Maximum | 98.3% | 95.1% |
| Range | 40.3% | 27.3% |
| Mean | 83.0% | 84.2% |
| Median | 84.3% | 84.9% |
| Interquartile 25% (IQ1) | 79.2% | 81.6% |
| Interquartile 75% (IQ3) | 87.4% | 87.3% |
| Interquartile Range (IQR) | 8.2% | 5.7% |
| Standard Deviation (Sample) | 7.7% | 5.2% |
| Standard Deviation (Population) | 7.7% | 5.2% |
Similar Demographics by GED/Equivalency
Demographics Similar to Immigrants from Bahamas by GED/Equivalency
In terms of ged/equivalency, the demographic groups most similar to Immigrants from Bahamas are Immigrants from South Eastern Asia (84.1%, a difference of 0.020%), Immigrants from Peru (84.2%, a difference of 0.030%), Subsaharan African (84.2%, a difference of 0.090%), Senegalese (84.0%, a difference of 0.15%), and Ghanaian (84.3%, a difference of 0.16%).
| Demographics | Rating | Rank | GED/Equivalency |
| Immigrants | South America | 4.2 /100 | #232 | Tragic 84.4% |
| Immigrants | Panama | 4.1 /100 | #233 | Tragic 84.4% |
| Immigrants | Nigeria | 3.6 /100 | #234 | Tragic 84.3% |
| Ghanaians | 3.5 /100 | #235 | Tragic 84.3% |
| Immigrants | Eritrea | 3.5 /100 | #236 | Tragic 84.3% |
| Sub-Saharan Africans | 3.0 /100 | #237 | Tragic 84.2% |
| Immigrants | Peru | 2.7 /100 | #238 | Tragic 84.2% |
| Immigrants | Bahamas | 2.6 /100 | #239 | Tragic 84.2% |
| Immigrants | South Eastern Asia | 2.5 /100 | #240 | Tragic 84.1% |
| Senegalese | 1.9 /100 | #241 | Tragic 84.0% |
| Sri Lankans | 1.9 /100 | #242 | Tragic 84.0% |
| Cherokee | 1.3 /100 | #243 | Tragic 83.9% |
| Immigrants | Ghana | 1.3 /100 | #244 | Tragic 83.9% |
| Immigrants | Senegal | 1.2 /100 | #245 | Tragic 83.8% |
| Chickasaw | 1.2 /100 | #246 | Tragic 83.8% |
Demographics Similar to Immigrants from Micronesia by GED/Equivalency
In terms of ged/equivalency, the demographic groups most similar to Immigrants from Micronesia are Nigerian (84.7%, a difference of 0.0%), Alaska Native (84.7%, a difference of 0.0%), Peruvian (84.7%, a difference of 0.030%), Potawatomi (84.7%, a difference of 0.030%), and American (84.7%, a difference of 0.030%).
| Demographics | Rating | Rank | GED/Equivalency |
| Colombians | 12.3 /100 | #209 | Poor 84.9% |
| Immigrants | Cameroon | 12.1 /100 | #210 | Poor 84.9% |
| South Americans | 10.9 /100 | #211 | Poor 84.8% |
| Immigrants | Somalia | 10.6 /100 | #212 | Poor 84.8% |
| Immigrants | Philippines | 10.0 /100 | #213 | Poor 84.8% |
| Osage | 9.5 /100 | #214 | Tragic 84.8% |
| Peruvians | 9.2 /100 | #215 | Tragic 84.7% |
| Immigrants | Micronesia | 8.7 /100 | #216 | Tragic 84.7% |
| Nigerians | 8.6 /100 | #217 | Tragic 84.7% |
| Alaska Natives | 8.6 /100 | #218 | Tragic 84.7% |
| Potawatomi | 8.2 /100 | #219 | Tragic 84.7% |
| Americans | 8.2 /100 | #220 | Tragic 84.7% |
| Taiwanese | 8.1 /100 | #221 | Tragic 84.7% |
| Iroquois | 7.5 /100 | #222 | Tragic 84.6% |
| Immigrants | Uzbekistan | 7.1 /100 | #223 | Tragic 84.6% |