Immigrants from Dominica vs Asian GED/Equivalency
COMPARE
Immigrants from Dominica
Asian
GED/Equivalency
GED/Equivalency Comparison
Immigrants from Dominica
Asians
81.1%
GED/EQUIVALENCY
0.0/ 100
METRIC RATING
307th/ 347
METRIC RANK
86.7%
GED/EQUIVALENCY
90.3/ 100
METRIC RATING
126th/ 347
METRIC RANK
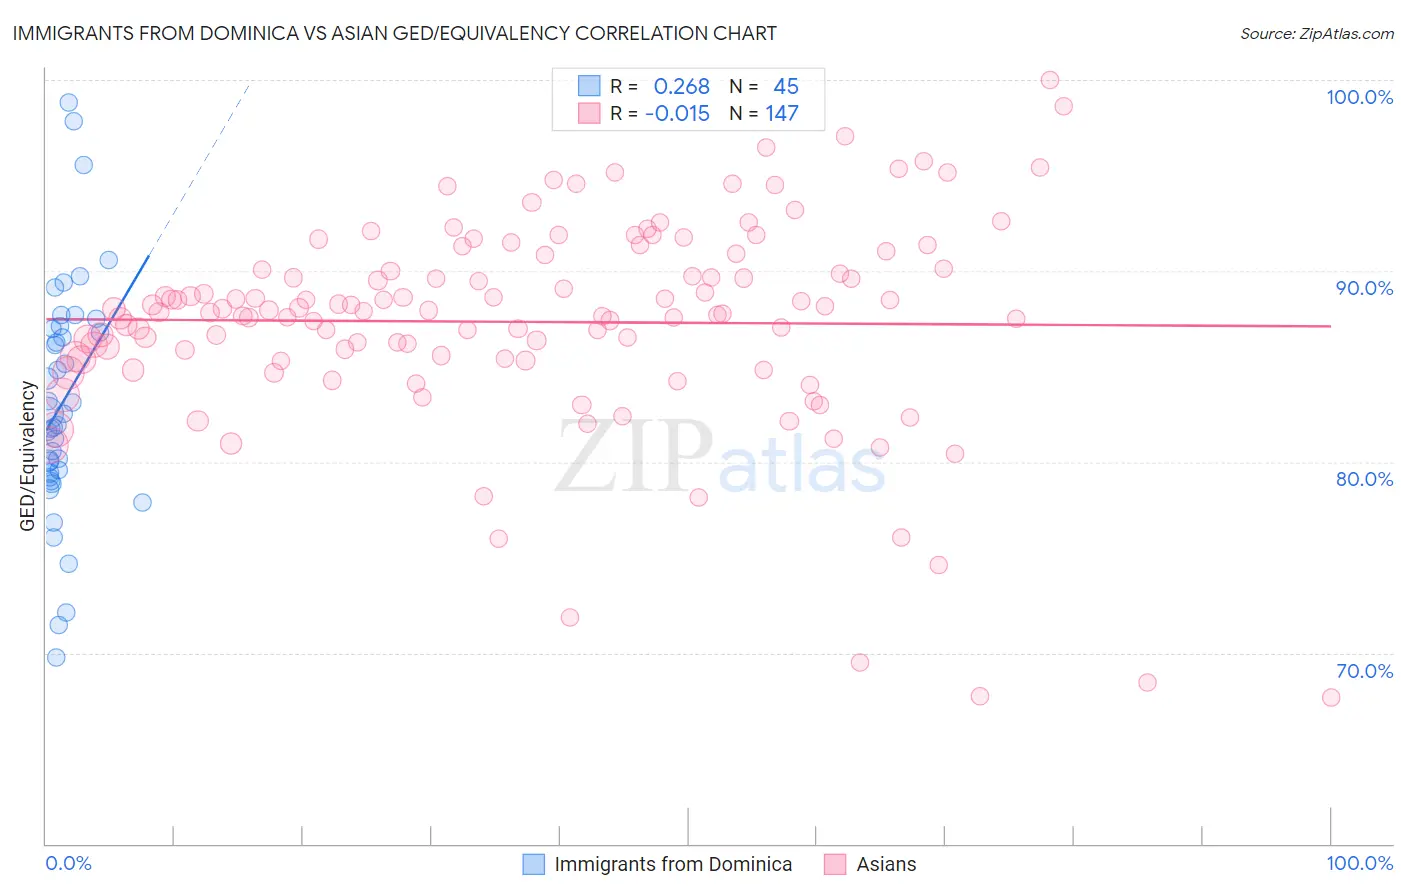
Immigrants from Dominica vs Asian GED/Equivalency Correlation Chart
The statistical analysis conducted on geographies consisting of 83,794,115 people shows a weak positive correlation between the proportion of Immigrants from Dominica and percentage of population with at least ged/equivalency education in the United States with a correlation coefficient (R) of 0.268 and weighted average of 81.1%. Similarly, the statistical analysis conducted on geographies consisting of 550,857,886 people shows no correlation between the proportion of Asians and percentage of population with at least ged/equivalency education in the United States with a correlation coefficient (R) of -0.015 and weighted average of 86.7%, a difference of 6.9%.
GED/Equivalency Correlation Summary
| Measurement | Immigrants from Dominica | Asian |
| Minimum | 69.7% | 67.7% |
| Maximum | 98.8% | 100.0% |
| Range | 29.1% | 32.3% |
| Mean | 83.1% | 87.3% |
| Median | 82.5% | 87.9% |
| Interquartile 25% (IQ1) | 79.3% | 85.4% |
| Interquartile 75% (IQ3) | 87.0% | 90.1% |
| Interquartile Range (IQR) | 7.8% | 4.8% |
| Standard Deviation (Sample) | 6.2% | 5.5% |
| Standard Deviation (Population) | 6.2% | 5.5% |
Similar Demographics by GED/Equivalency
Demographics Similar to Immigrants from Dominica by GED/Equivalency
In terms of ged/equivalency, the demographic groups most similar to Immigrants from Dominica are Puerto Rican (81.1%, a difference of 0.10%), Guyanese (81.3%, a difference of 0.17%), Immigrants from Ecuador (81.0%, a difference of 0.18%), Immigrants from Grenada (81.3%, a difference of 0.19%), and Immigrants from Guyana (81.0%, a difference of 0.25%).
| Demographics | Rating | Rank | GED/Equivalency |
| Fijians | 0.0 /100 | #300 | Tragic 81.6% |
| Dutch West Indians | 0.0 /100 | #301 | Tragic 81.6% |
| Immigrants | Haiti | 0.0 /100 | #302 | Tragic 81.6% |
| Immigrants | Portugal | 0.0 /100 | #303 | Tragic 81.6% |
| Navajo | 0.0 /100 | #304 | Tragic 81.5% |
| Immigrants | Grenada | 0.0 /100 | #305 | Tragic 81.3% |
| Guyanese | 0.0 /100 | #306 | Tragic 81.3% |
| Immigrants | Dominica | 0.0 /100 | #307 | Tragic 81.1% |
| Puerto Ricans | 0.0 /100 | #308 | Tragic 81.1% |
| Immigrants | Ecuador | 0.0 /100 | #309 | Tragic 81.0% |
| Immigrants | Guyana | 0.0 /100 | #310 | Tragic 81.0% |
| Natives/Alaskans | 0.0 /100 | #311 | Tragic 80.9% |
| Nicaraguans | 0.0 /100 | #312 | Tragic 80.9% |
| Cape Verdeans | 0.0 /100 | #313 | Tragic 80.9% |
| Belizeans | 0.0 /100 | #314 | Tragic 80.9% |
Demographics Similar to Asians by GED/Equivalency
In terms of ged/equivalency, the demographic groups most similar to Asians are Immigrants from Egypt (86.7%, a difference of 0.010%), Celtic (86.7%, a difference of 0.010%), Immigrants from Italy (86.7%, a difference of 0.020%), Immigrants from Jordan (86.8%, a difference of 0.030%), and Argentinean (86.7%, a difference of 0.030%).
| Demographics | Rating | Rank | GED/Equivalency |
| Immigrants | China | 93.2 /100 | #119 | Exceptional 86.9% |
| Scotch-Irish | 91.6 /100 | #120 | Exceptional 86.8% |
| Immigrants | Lebanon | 90.9 /100 | #121 | Exceptional 86.8% |
| Immigrants | Jordan | 90.8 /100 | #122 | Exceptional 86.8% |
| Immigrants | Italy | 90.5 /100 | #123 | Exceptional 86.7% |
| Immigrants | Egypt | 90.4 /100 | #124 | Exceptional 86.7% |
| Celtics | 90.4 /100 | #125 | Exceptional 86.7% |
| Asians | 90.3 /100 | #126 | Exceptional 86.7% |
| Argentineans | 89.7 /100 | #127 | Excellent 86.7% |
| Yugoslavians | 89.5 /100 | #128 | Excellent 86.7% |
| Immigrants | Ukraine | 88.9 /100 | #129 | Excellent 86.7% |
| Immigrants | Germany | 88.8 /100 | #130 | Excellent 86.7% |
| Immigrants | Spain | 88.5 /100 | #131 | Excellent 86.7% |
| Immigrants | Brazil | 88.4 /100 | #132 | Excellent 86.6% |
| Tsimshian | 88.3 /100 | #133 | Excellent 86.6% |