Immigrants from France vs Immigrants from Micronesia GED/Equivalency
COMPARE
Immigrants from France
Immigrants from Micronesia
GED/Equivalency
GED/Equivalency Comparison
Immigrants from France
Immigrants from Micronesia
87.8%
GED/EQUIVALENCY
99.1/ 100
METRIC RATING
68th/ 347
METRIC RANK
84.7%
GED/EQUIVALENCY
8.7/ 100
METRIC RATING
216th/ 347
METRIC RANK
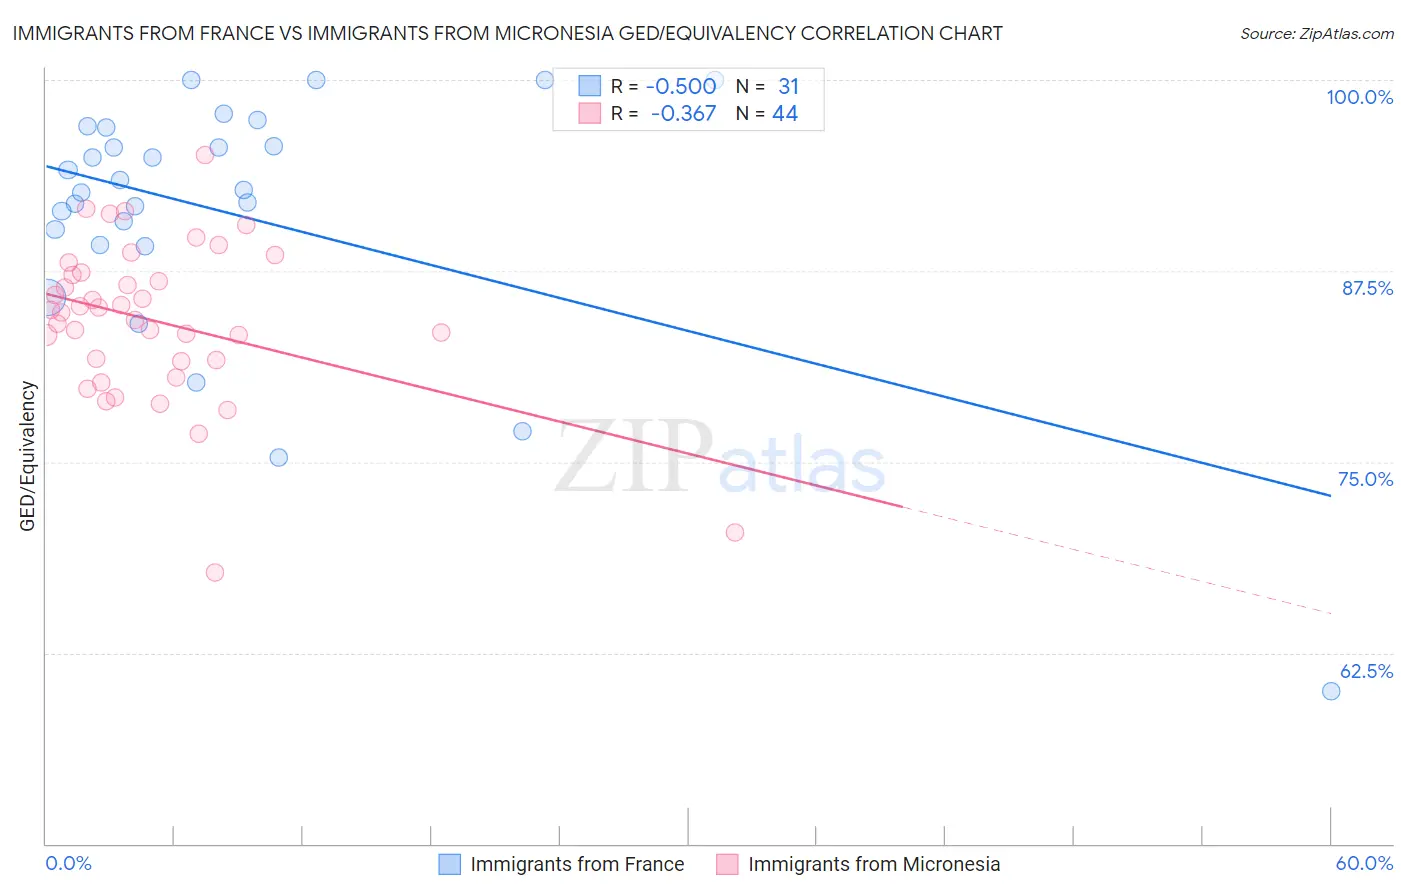
Immigrants from France vs Immigrants from Micronesia GED/Equivalency Correlation Chart
The statistical analysis conducted on geographies consisting of 287,920,906 people shows a substantial negative correlation between the proportion of Immigrants from France and percentage of population with at least ged/equivalency education in the United States with a correlation coefficient (R) of -0.500 and weighted average of 87.8%. Similarly, the statistical analysis conducted on geographies consisting of 61,609,499 people shows a mild negative correlation between the proportion of Immigrants from Micronesia and percentage of population with at least ged/equivalency education in the United States with a correlation coefficient (R) of -0.367 and weighted average of 84.7%, a difference of 3.7%.
GED/Equivalency Correlation Summary
| Measurement | Immigrants from France | Immigrants from Micronesia |
| Minimum | 60.0% | 67.7% |
| Maximum | 100.0% | 95.1% |
| Range | 40.0% | 27.3% |
| Mean | 91.2% | 84.2% |
| Median | 92.8% | 84.9% |
| Interquartile 25% (IQ1) | 89.2% | 81.6% |
| Interquartile 75% (IQ3) | 96.9% | 87.3% |
| Interquartile Range (IQR) | 7.7% | 5.7% |
| Standard Deviation (Sample) | 8.6% | 5.2% |
| Standard Deviation (Population) | 8.4% | 5.2% |
Similar Demographics by GED/Equivalency
Demographics Similar to Immigrants from France by GED/Equivalency
In terms of ged/equivalency, the demographic groups most similar to Immigrants from France are British (87.8%, a difference of 0.0%), Immigrants from Bulgaria (87.8%, a difference of 0.010%), Immigrants from North America (87.8%, a difference of 0.020%), Immigrants from Canada (87.9%, a difference of 0.050%), and Immigrants from Saudi Arabia (87.8%, a difference of 0.070%).
| Demographics | Rating | Rank | GED/Equivalency |
| Europeans | 99.3 /100 | #61 | Exceptional 87.9% |
| Germans | 99.3 /100 | #62 | Exceptional 87.9% |
| Immigrants | Turkey | 99.2 /100 | #63 | Exceptional 87.9% |
| Immigrants | Canada | 99.2 /100 | #64 | Exceptional 87.9% |
| Immigrants | North America | 99.1 /100 | #65 | Exceptional 87.8% |
| Immigrants | Bulgaria | 99.1 /100 | #66 | Exceptional 87.8% |
| British | 99.1 /100 | #67 | Exceptional 87.8% |
| Immigrants | France | 99.1 /100 | #68 | Exceptional 87.8% |
| Immigrants | Saudi Arabia | 99.0 /100 | #69 | Exceptional 87.8% |
| Ukrainians | 98.8 /100 | #70 | Exceptional 87.7% |
| Austrians | 98.8 /100 | #71 | Exceptional 87.7% |
| Immigrants | Moldova | 98.8 /100 | #72 | Exceptional 87.7% |
| Belgians | 98.8 /100 | #73 | Exceptional 87.7% |
| Immigrants | Kuwait | 98.8 /100 | #74 | Exceptional 87.7% |
| Scottish | 98.7 /100 | #75 | Exceptional 87.7% |
Demographics Similar to Immigrants from Micronesia by GED/Equivalency
In terms of ged/equivalency, the demographic groups most similar to Immigrants from Micronesia are Nigerian (84.7%, a difference of 0.0%), Alaska Native (84.7%, a difference of 0.0%), Peruvian (84.7%, a difference of 0.030%), Potawatomi (84.7%, a difference of 0.030%), and American (84.7%, a difference of 0.030%).
| Demographics | Rating | Rank | GED/Equivalency |
| Colombians | 12.3 /100 | #209 | Poor 84.9% |
| Immigrants | Cameroon | 12.1 /100 | #210 | Poor 84.9% |
| South Americans | 10.9 /100 | #211 | Poor 84.8% |
| Immigrants | Somalia | 10.6 /100 | #212 | Poor 84.8% |
| Immigrants | Philippines | 10.0 /100 | #213 | Poor 84.8% |
| Osage | 9.5 /100 | #214 | Tragic 84.8% |
| Peruvians | 9.2 /100 | #215 | Tragic 84.7% |
| Immigrants | Micronesia | 8.7 /100 | #216 | Tragic 84.7% |
| Nigerians | 8.6 /100 | #217 | Tragic 84.7% |
| Alaska Natives | 8.6 /100 | #218 | Tragic 84.7% |
| Potawatomi | 8.2 /100 | #219 | Tragic 84.7% |
| Americans | 8.2 /100 | #220 | Tragic 84.7% |
| Taiwanese | 8.1 /100 | #221 | Tragic 84.7% |
| Iroquois | 7.5 /100 | #222 | Tragic 84.6% |
| Immigrants | Uzbekistan | 7.1 /100 | #223 | Tragic 84.6% |