Immigrants from Denmark vs Menominee Householder Income Over 65 years
COMPARE
Immigrants from Denmark
Menominee
Householder Income Over 65 years
Householder Income Over 65 years Comparison
Immigrants from Denmark
Menominee
$68,801
HOUSEHOLDER INCOME OVER 65 YEARS
100.0/ 100
METRIC RATING
33rd/ 347
METRIC RANK
$51,719
HOUSEHOLDER INCOME OVER 65 YEARS
0.0/ 100
METRIC RATING
321st/ 347
METRIC RANK
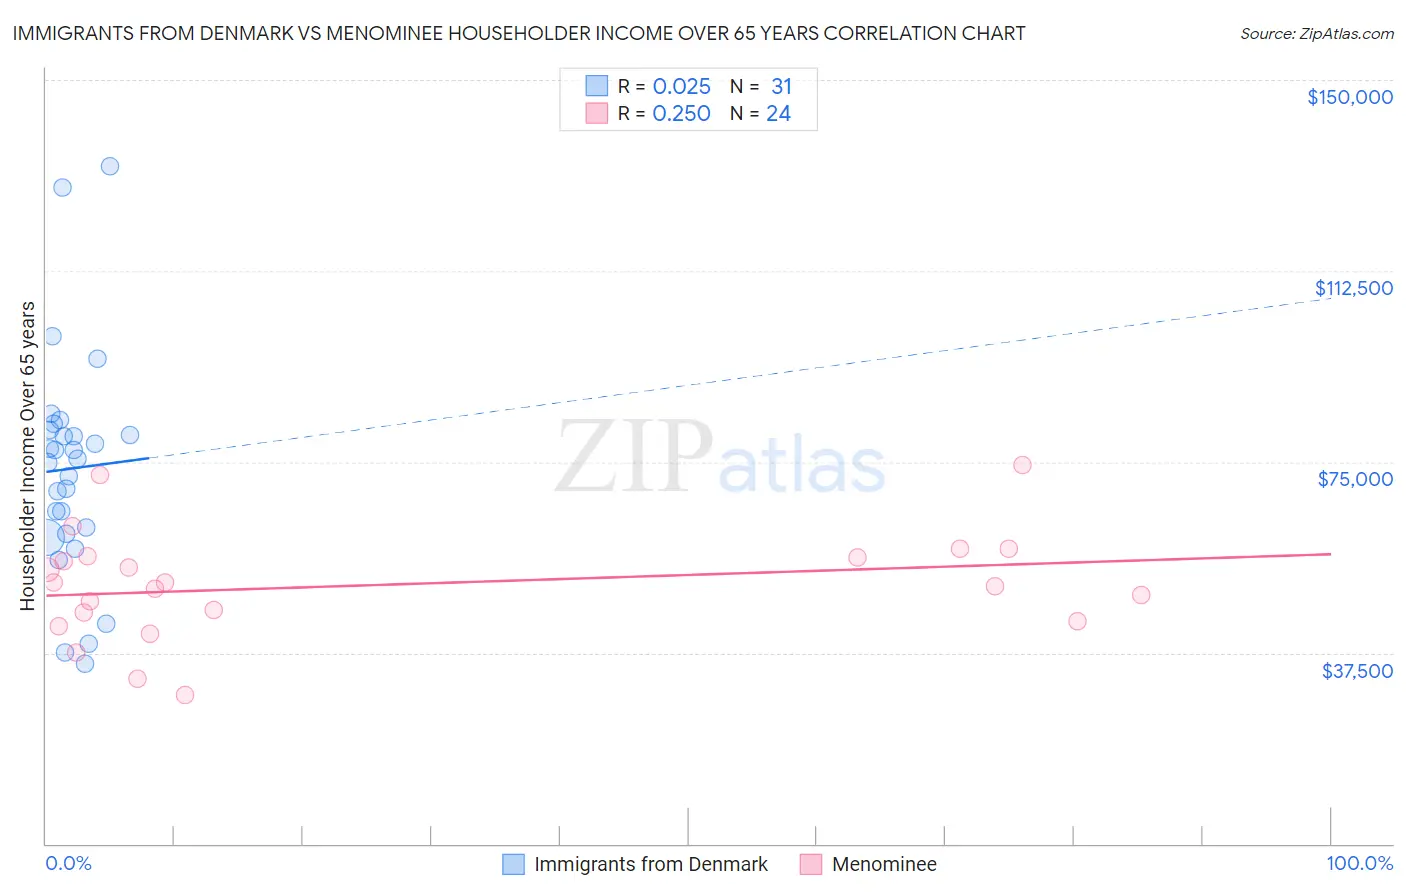
Immigrants from Denmark vs Menominee Householder Income Over 65 years Correlation Chart
The statistical analysis conducted on geographies consisting of 136,337,207 people shows no correlation between the proportion of Immigrants from Denmark and household income with householder over the age of 65 in the United States with a correlation coefficient (R) of 0.025 and weighted average of $68,801. Similarly, the statistical analysis conducted on geographies consisting of 45,767,067 people shows a weak positive correlation between the proportion of Menominee and household income with householder over the age of 65 in the United States with a correlation coefficient (R) of 0.250 and weighted average of $51,719, a difference of 33.0%.
Householder Income Over 65 years Correlation Summary
| Measurement | Immigrants from Denmark | Menominee |
| Minimum | $35,313 | $29,125 |
| Maximum | $133,125 | $74,432 |
| Range | $97,812 | $45,307 |
| Mean | $73,669 | $50,793 |
| Median | $75,568 | $50,939 |
| Interquartile 25% (IQ1) | $60,884 | $44,602 |
| Interquartile 75% (IQ3) | $81,334 | $56,259 |
| Interquartile Range (IQR) | $20,450 | $11,657 |
| Standard Deviation (Sample) | $21,898 | $10,695 |
| Standard Deviation (Population) | $21,542 | $10,470 |
Similar Demographics by Householder Income Over 65 years
Demographics Similar to Immigrants from Denmark by Householder Income Over 65 years
In terms of householder income over 65 years, the demographic groups most similar to Immigrants from Denmark are Asian ($68,822, a difference of 0.030%), Afghan ($68,951, a difference of 0.22%), Immigrants from Northern Europe ($69,003, a difference of 0.29%), Immigrants from Ireland ($68,495, a difference of 0.45%), and Immigrants from Australia ($69,164, a difference of 0.53%).
| Demographics | Rating | Rank | Householder Income Over 65 years |
| Immigrants | Sri Lanka | 100.0 /100 | #26 | Exceptional $69,426 |
| Immigrants | Switzerland | 100.0 /100 | #27 | Exceptional $69,343 |
| Immigrants | China | 100.0 /100 | #28 | Exceptional $69,174 |
| Immigrants | Australia | 100.0 /100 | #29 | Exceptional $69,164 |
| Immigrants | Northern Europe | 100.0 /100 | #30 | Exceptional $69,003 |
| Afghans | 100.0 /100 | #31 | Exceptional $68,951 |
| Asians | 100.0 /100 | #32 | Exceptional $68,822 |
| Immigrants | Denmark | 100.0 /100 | #33 | Exceptional $68,801 |
| Immigrants | Ireland | 100.0 /100 | #34 | Exceptional $68,495 |
| Tongans | 100.0 /100 | #35 | Exceptional $68,235 |
| Immigrants | Austria | 99.9 /100 | #36 | Exceptional $68,208 |
| Turks | 99.9 /100 | #37 | Exceptional $68,037 |
| Estonians | 99.9 /100 | #38 | Exceptional $67,926 |
| Russians | 99.9 /100 | #39 | Exceptional $67,626 |
| Immigrants | Asia | 99.9 /100 | #40 | Exceptional $67,594 |
Demographics Similar to Menominee by Householder Income Over 65 years
In terms of householder income over 65 years, the demographic groups most similar to Menominee are Colville ($51,739, a difference of 0.040%), Immigrants from Honduras ($51,888, a difference of 0.33%), Haitian ($51,912, a difference of 0.37%), Immigrants from St. Vincent and the Grenadines ($51,922, a difference of 0.39%), and Creek ($51,949, a difference of 0.45%).
| Demographics | Rating | Rank | Householder Income Over 65 years |
| Natives/Alaskans | 0.0 /100 | #314 | Tragic $52,081 |
| U.S. Virgin Islanders | 0.0 /100 | #315 | Tragic $52,072 |
| Creek | 0.0 /100 | #316 | Tragic $51,949 |
| Immigrants | St. Vincent and the Grenadines | 0.0 /100 | #317 | Tragic $51,922 |
| Haitians | 0.0 /100 | #318 | Tragic $51,912 |
| Immigrants | Honduras | 0.0 /100 | #319 | Tragic $51,888 |
| Colville | 0.0 /100 | #320 | Tragic $51,739 |
| Menominee | 0.0 /100 | #321 | Tragic $51,719 |
| British West Indians | 0.0 /100 | #322 | Tragic $51,463 |
| Cajuns | 0.0 /100 | #323 | Tragic $51,397 |
| Immigrants | Congo | 0.0 /100 | #324 | Tragic $51,393 |
| Immigrants | Haiti | 0.0 /100 | #325 | Tragic $51,219 |
| Kiowa | 0.0 /100 | #326 | Tragic $51,140 |
| Bahamians | 0.0 /100 | #327 | Tragic $51,000 |
| Hopi | 0.0 /100 | #328 | Tragic $50,925 |