Immigrants from Croatia vs Mexican In Labor Force | Age 16-19
COMPARE
Immigrants from Croatia
Mexican
In Labor Force | Age 16-19
In Labor Force | Age 16-19 Comparison
Immigrants from Croatia
Mexicans
36.1%
IN LABOR FORCE | AGE 16-19
27.5/ 100
METRIC RATING
191st/ 347
METRIC RANK
35.6%
IN LABOR FORCE | AGE 16-19
11.9/ 100
METRIC RATING
211th/ 347
METRIC RANK
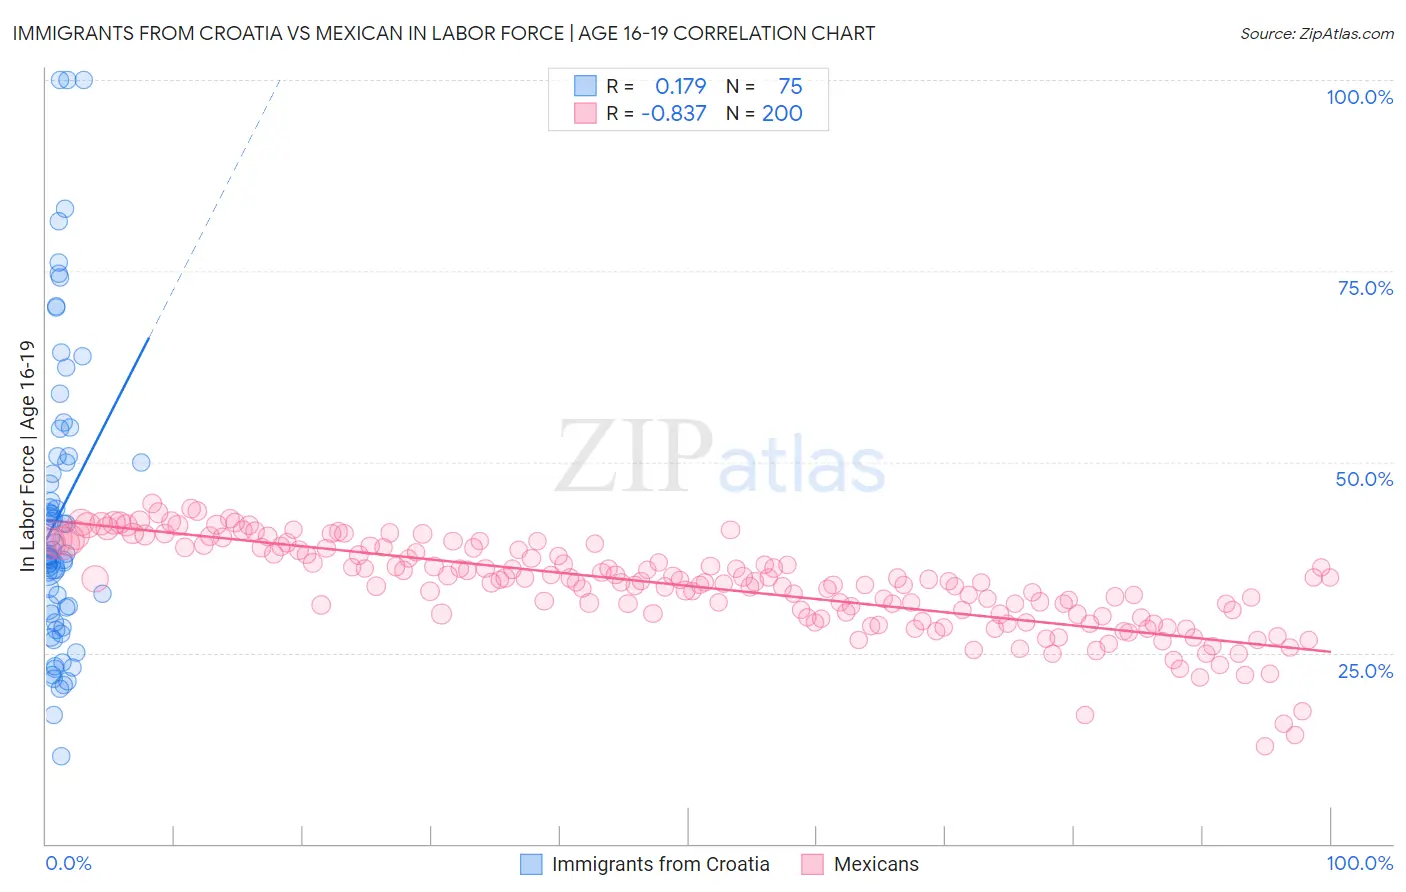
Immigrants from Croatia vs Mexican In Labor Force | Age 16-19 Correlation Chart
The statistical analysis conducted on geographies consisting of 132,497,839 people shows a poor positive correlation between the proportion of Immigrants from Croatia and labor force participation rate among population between the ages 16 and 19 in the United States with a correlation coefficient (R) of 0.179 and weighted average of 36.1%. Similarly, the statistical analysis conducted on geographies consisting of 561,746,144 people shows a very strong negative correlation between the proportion of Mexicans and labor force participation rate among population between the ages 16 and 19 in the United States with a correlation coefficient (R) of -0.837 and weighted average of 35.6%, a difference of 1.3%.
In Labor Force | Age 16-19 Correlation Summary
| Measurement | Immigrants from Croatia | Mexican |
| Minimum | 11.5% | 12.7% |
| Maximum | 100.0% | 44.6% |
| Range | 88.5% | 31.8% |
| Mean | 43.3% | 33.8% |
| Median | 37.8% | 34.3% |
| Interquartile 25% (IQ1) | 30.1% | 30.0% |
| Interquartile 75% (IQ3) | 50.7% | 38.7% |
| Interquartile Range (IQR) | 20.6% | 8.7% |
| Standard Deviation (Sample) | 19.6% | 6.0% |
| Standard Deviation (Population) | 19.5% | 6.0% |
Demographics Similar to Immigrants from Croatia and Mexicans by In Labor Force | Age 16-19
In terms of in labor force | age 16-19, the demographic groups most similar to Immigrants from Croatia are Afghan (36.1%, a difference of 0.12%), Immigrants from Denmark (36.1%, a difference of 0.17%), Nigerian (36.1%, a difference of 0.19%), Bolivian (36.0%, a difference of 0.29%), and Mexican American Indian (36.0%, a difference of 0.45%). Similarly, the demographic groups most similar to Mexicans are Immigrants from Switzerland (35.6%, a difference of 0.0%), Moroccan (35.7%, a difference of 0.10%), Korean (35.7%, a difference of 0.17%), Immigrants from Eastern Europe (35.8%, a difference of 0.29%), and South American Indian (35.8%, a difference of 0.31%).
| Demographics | Rating | Rank | In Labor Force | Age 16-19 |
| Immigrants | Croatia | 27.5 /100 | #191 | Fair 36.1% |
| Afghans | 25.7 /100 | #192 | Fair 36.1% |
| Immigrants | Denmark | 25.0 /100 | #193 | Fair 36.1% |
| Nigerians | 24.6 /100 | #194 | Fair 36.1% |
| Bolivians | 23.3 /100 | #195 | Fair 36.0% |
| Mexican American Indians | 21.1 /100 | #196 | Fair 36.0% |
| Immigrants | Serbia | 21.0 /100 | #197 | Fair 36.0% |
| Immigrants | Northern Africa | 19.9 /100 | #198 | Poor 35.9% |
| Immigrants | Norway | 19.8 /100 | #199 | Poor 35.9% |
| Immigrants | Sweden | 18.8 /100 | #200 | Poor 35.9% |
| Alsatians | 17.5 /100 | #201 | Poor 35.9% |
| Senegalese | 17.4 /100 | #202 | Poor 35.9% |
| Immigrants | Nigeria | 16.8 /100 | #203 | Poor 35.8% |
| Immigrants | Albania | 15.0 /100 | #204 | Poor 35.8% |
| South American Indians | 14.6 /100 | #205 | Poor 35.8% |
| Chileans | 14.6 /100 | #206 | Poor 35.8% |
| Immigrants | Eastern Europe | 14.5 /100 | #207 | Poor 35.8% |
| Koreans | 13.3 /100 | #208 | Poor 35.7% |
| Moroccans | 12.7 /100 | #209 | Poor 35.7% |
| Immigrants | Switzerland | 11.9 /100 | #210 | Poor 35.6% |
| Mexicans | 11.9 /100 | #211 | Poor 35.6% |