Immigrants from Croatia vs Immigrants from Haiti College, Under 1 year
COMPARE
Immigrants from Croatia
Immigrants from Haiti
College, Under 1 year
College, Under 1 year Comparison
Immigrants from Croatia
Immigrants from Haiti
67.8%
COLLEGE, UNDER 1 YEAR
96.6/ 100
METRIC RATING
106th/ 347
METRIC RANK
56.9%
COLLEGE, UNDER 1 YEAR
0.0/ 100
METRIC RATING
318th/ 347
METRIC RANK
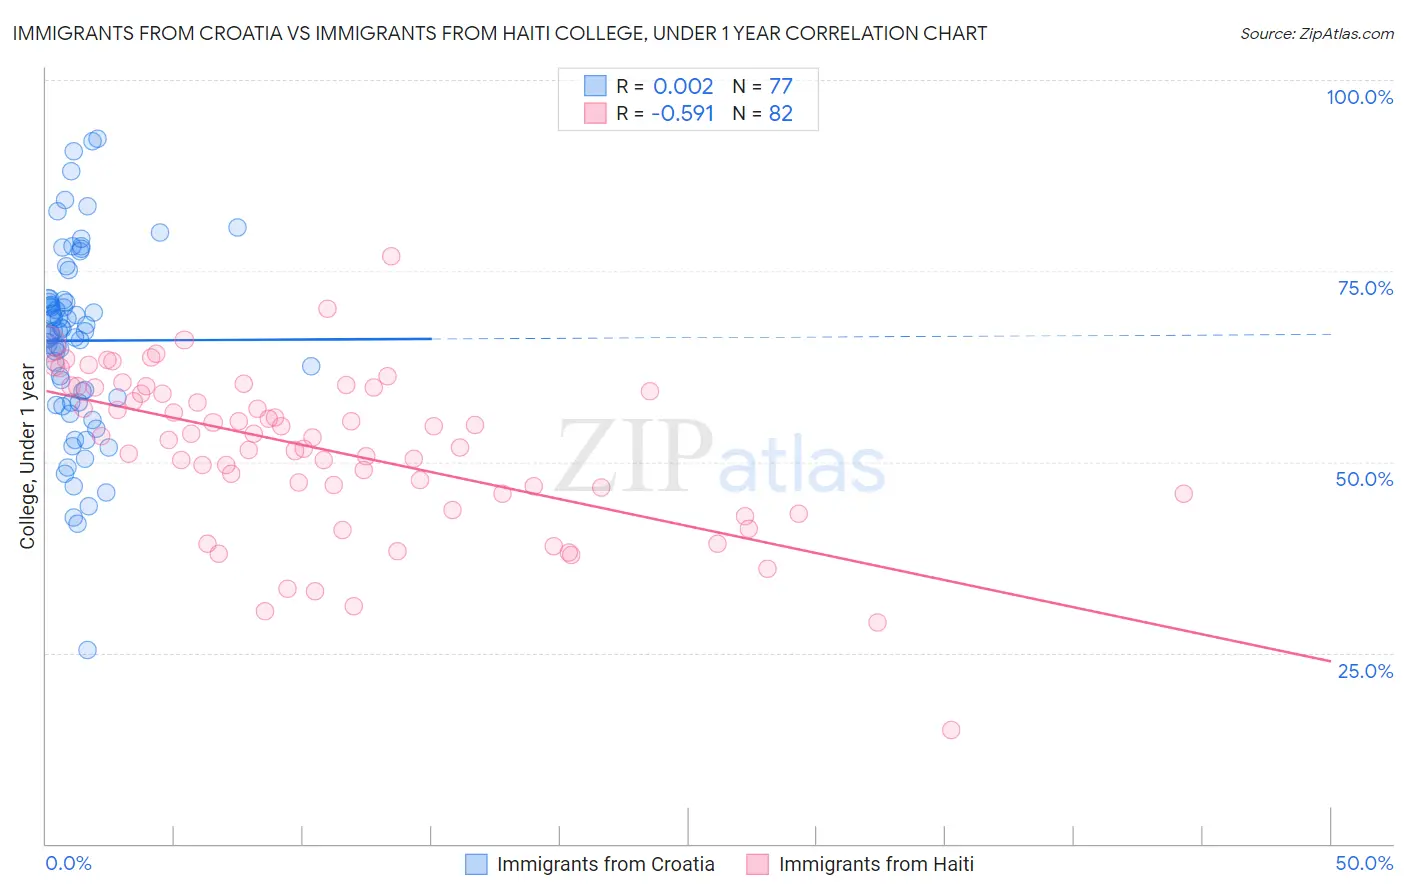
Immigrants from Croatia vs Immigrants from Haiti College, Under 1 year Correlation Chart
The statistical analysis conducted on geographies consisting of 132,577,989 people shows no correlation between the proportion of Immigrants from Croatia and percentage of population with at least college, under 1 year education in the United States with a correlation coefficient (R) of 0.002 and weighted average of 67.8%. Similarly, the statistical analysis conducted on geographies consisting of 225,287,293 people shows a substantial negative correlation between the proportion of Immigrants from Haiti and percentage of population with at least college, under 1 year education in the United States with a correlation coefficient (R) of -0.591 and weighted average of 56.9%, a difference of 19.1%.
College, Under 1 year Correlation Summary
| Measurement | Immigrants from Croatia | Immigrants from Haiti |
| Minimum | 25.4% | 14.8% |
| Maximum | 92.2% | 76.9% |
| Range | 66.8% | 62.1% |
| Mean | 65.9% | 51.5% |
| Median | 67.1% | 53.3% |
| Interquartile 25% (IQ1) | 57.8% | 45.9% |
| Interquartile 75% (IQ3) | 71.3% | 59.7% |
| Interquartile Range (IQR) | 13.5% | 13.8% |
| Standard Deviation (Sample) | 12.3% | 10.6% |
| Standard Deviation (Population) | 12.3% | 10.5% |
Similar Demographics by College, Under 1 year
Demographics Similar to Immigrants from Croatia by College, Under 1 year
In terms of college, under 1 year, the demographic groups most similar to Immigrants from Croatia are Immigrants from Western Asia (67.8%, a difference of 0.010%), Afghan (67.8%, a difference of 0.010%), Austrian (67.8%, a difference of 0.060%), Palestinian (67.9%, a difference of 0.090%), and Carpatho Rusyn (67.9%, a difference of 0.090%).
| Demographics | Rating | Rank | College, Under 1 year |
| Immigrants | Bolivia | 97.0 /100 | #99 | Exceptional 67.9% |
| Immigrants | Argentina | 97.0 /100 | #100 | Exceptional 67.9% |
| Immigrants | Eastern Europe | 96.9 /100 | #101 | Exceptional 67.9% |
| Palestinians | 96.9 /100 | #102 | Exceptional 67.9% |
| Carpatho Rusyns | 96.8 /100 | #103 | Exceptional 67.9% |
| Immigrants | Western Asia | 96.6 /100 | #104 | Exceptional 67.8% |
| Afghans | 96.6 /100 | #105 | Exceptional 67.8% |
| Immigrants | Croatia | 96.6 /100 | #106 | Exceptional 67.8% |
| Austrians | 96.4 /100 | #107 | Exceptional 67.8% |
| Immigrants | Egypt | 96.0 /100 | #108 | Exceptional 67.7% |
| Scandinavians | 95.8 /100 | #109 | Exceptional 67.7% |
| Assyrians/Chaldeans/Syriacs | 95.8 /100 | #110 | Exceptional 67.7% |
| Ukrainians | 95.8 /100 | #111 | Exceptional 67.7% |
| Macedonians | 95.7 /100 | #112 | Exceptional 67.6% |
| Syrians | 95.6 /100 | #113 | Exceptional 67.6% |
Demographics Similar to Immigrants from Haiti by College, Under 1 year
In terms of college, under 1 year, the demographic groups most similar to Immigrants from Haiti are Hispanic or Latino (57.0%, a difference of 0.12%), Menominee (57.0%, a difference of 0.16%), Puerto Rican (56.8%, a difference of 0.20%), Honduran (57.1%, a difference of 0.21%), and Hopi (57.1%, a difference of 0.25%).
| Demographics | Rating | Rank | College, Under 1 year |
| Cajuns | 0.0 /100 | #311 | Tragic 57.3% |
| Salvadorans | 0.0 /100 | #312 | Tragic 57.3% |
| Dutch West Indians | 0.0 /100 | #313 | Tragic 57.2% |
| Hopi | 0.0 /100 | #314 | Tragic 57.1% |
| Hondurans | 0.0 /100 | #315 | Tragic 57.1% |
| Menominee | 0.0 /100 | #316 | Tragic 57.0% |
| Hispanics or Latinos | 0.0 /100 | #317 | Tragic 57.0% |
| Immigrants | Haiti | 0.0 /100 | #318 | Tragic 56.9% |
| Puerto Ricans | 0.0 /100 | #319 | Tragic 56.8% |
| Guatemalans | 0.0 /100 | #320 | Tragic 56.8% |
| Natives/Alaskans | 0.0 /100 | #321 | Tragic 56.6% |
| Immigrants | Caribbean | 0.0 /100 | #322 | Tragic 56.6% |
| Immigrants | Honduras | 0.0 /100 | #323 | Tragic 56.5% |
| Immigrants | El Salvador | 0.0 /100 | #324 | Tragic 56.4% |
| Immigrants | Latin America | 0.0 /100 | #325 | Tragic 56.3% |