Immigrants from Croatia vs Dutch College, Under 1 year
COMPARE
Immigrants from Croatia
Dutch
College, Under 1 year
College, Under 1 year Comparison
Immigrants from Croatia
Dutch
67.8%
COLLEGE, UNDER 1 YEAR
96.6/ 100
METRIC RATING
106th/ 347
METRIC RANK
65.3%
COLLEGE, UNDER 1 YEAR
46.1/ 100
METRIC RATING
180th/ 347
METRIC RANK
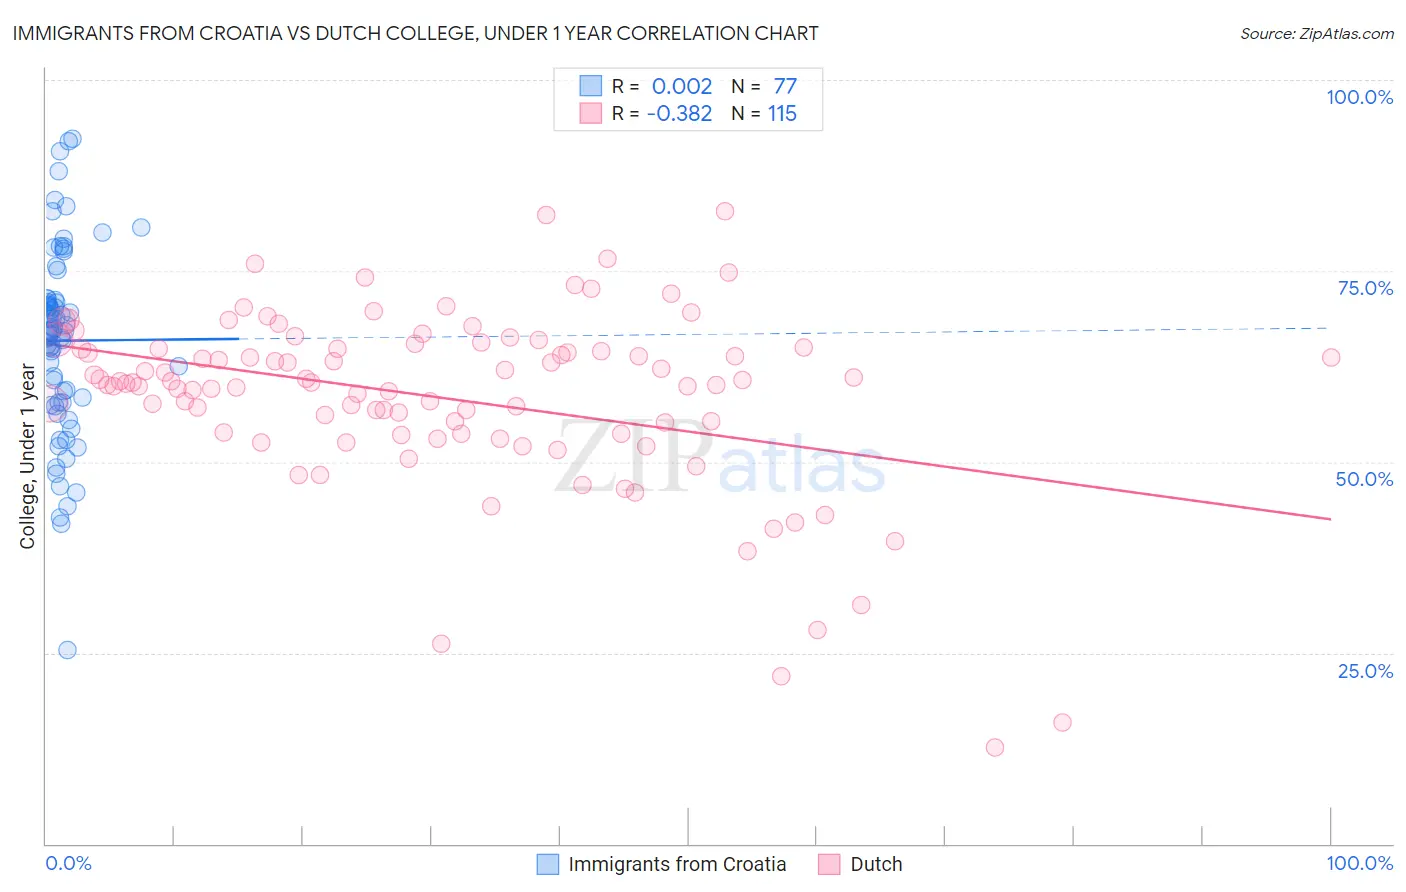
Immigrants from Croatia vs Dutch College, Under 1 year Correlation Chart
The statistical analysis conducted on geographies consisting of 132,577,989 people shows no correlation between the proportion of Immigrants from Croatia and percentage of population with at least college, under 1 year education in the United States with a correlation coefficient (R) of 0.002 and weighted average of 67.8%. Similarly, the statistical analysis conducted on geographies consisting of 554,354,714 people shows a mild negative correlation between the proportion of Dutch and percentage of population with at least college, under 1 year education in the United States with a correlation coefficient (R) of -0.382 and weighted average of 65.3%, a difference of 3.9%.
College, Under 1 year Correlation Summary
| Measurement | Immigrants from Croatia | Dutch |
| Minimum | 25.4% | 12.6% |
| Maximum | 92.2% | 82.8% |
| Range | 66.8% | 70.1% |
| Mean | 65.9% | 58.4% |
| Median | 67.1% | 60.4% |
| Interquartile 25% (IQ1) | 57.8% | 53.7% |
| Interquartile 75% (IQ3) | 71.3% | 64.8% |
| Interquartile Range (IQR) | 13.5% | 11.1% |
| Standard Deviation (Sample) | 12.3% | 11.9% |
| Standard Deviation (Population) | 12.3% | 11.8% |
Similar Demographics by College, Under 1 year
Demographics Similar to Immigrants from Croatia by College, Under 1 year
In terms of college, under 1 year, the demographic groups most similar to Immigrants from Croatia are Immigrants from Western Asia (67.8%, a difference of 0.010%), Afghan (67.8%, a difference of 0.010%), Austrian (67.8%, a difference of 0.060%), Palestinian (67.9%, a difference of 0.090%), and Carpatho Rusyn (67.9%, a difference of 0.090%).
| Demographics | Rating | Rank | College, Under 1 year |
| Immigrants | Bolivia | 97.0 /100 | #99 | Exceptional 67.9% |
| Immigrants | Argentina | 97.0 /100 | #100 | Exceptional 67.9% |
| Immigrants | Eastern Europe | 96.9 /100 | #101 | Exceptional 67.9% |
| Palestinians | 96.9 /100 | #102 | Exceptional 67.9% |
| Carpatho Rusyns | 96.8 /100 | #103 | Exceptional 67.9% |
| Immigrants | Western Asia | 96.6 /100 | #104 | Exceptional 67.8% |
| Afghans | 96.6 /100 | #105 | Exceptional 67.8% |
| Immigrants | Croatia | 96.6 /100 | #106 | Exceptional 67.8% |
| Austrians | 96.4 /100 | #107 | Exceptional 67.8% |
| Immigrants | Egypt | 96.0 /100 | #108 | Exceptional 67.7% |
| Scandinavians | 95.8 /100 | #109 | Exceptional 67.7% |
| Assyrians/Chaldeans/Syriacs | 95.8 /100 | #110 | Exceptional 67.7% |
| Ukrainians | 95.8 /100 | #111 | Exceptional 67.7% |
| Macedonians | 95.7 /100 | #112 | Exceptional 67.6% |
| Syrians | 95.6 /100 | #113 | Exceptional 67.6% |
Demographics Similar to Dutch by College, Under 1 year
In terms of college, under 1 year, the demographic groups most similar to Dutch are Spaniard (65.3%, a difference of 0.030%), Immigrants from Africa (65.3%, a difference of 0.060%), Guamanian/Chamorro (65.4%, a difference of 0.090%), German Russian (65.4%, a difference of 0.10%), and Immigrants from North Macedonia (65.4%, a difference of 0.11%).
| Demographics | Rating | Rank | College, Under 1 year |
| Swiss | 53.9 /100 | #173 | Average 65.5% |
| Immigrants | Bosnia and Herzegovina | 50.0 /100 | #174 | Average 65.4% |
| Scotch-Irish | 49.5 /100 | #175 | Average 65.4% |
| French | 48.9 /100 | #176 | Average 65.4% |
| Immigrants | North Macedonia | 48.6 /100 | #177 | Average 65.4% |
| German Russians | 48.3 /100 | #178 | Average 65.4% |
| Guamanians/Chamorros | 48.2 /100 | #179 | Average 65.4% |
| Dutch | 46.1 /100 | #180 | Average 65.3% |
| Spaniards | 45.5 /100 | #181 | Average 65.3% |
| Immigrants | Africa | 44.7 /100 | #182 | Average 65.3% |
| Immigrants | Poland | 42.6 /100 | #183 | Average 65.2% |
| Bermudans | 42.0 /100 | #184 | Average 65.2% |
| Sri Lankans | 41.7 /100 | #185 | Average 65.2% |
| Immigrants | Sierra Leone | 39.7 /100 | #186 | Fair 65.1% |
| Immigrants | Southern Europe | 34.3 /100 | #187 | Fair 64.9% |