English vs Immigrants from Vietnam College, Under 1 year
COMPARE
English
Immigrants from Vietnam
College, Under 1 year
College, Under 1 year Comparison
English
Immigrants from Vietnam
66.6%
COLLEGE, UNDER 1 YEAR
82.9/ 100
METRIC RATING
142nd/ 347
METRIC RANK
64.0%
COLLEGE, UNDER 1 YEAR
12.1/ 100
METRIC RATING
208th/ 347
METRIC RANK
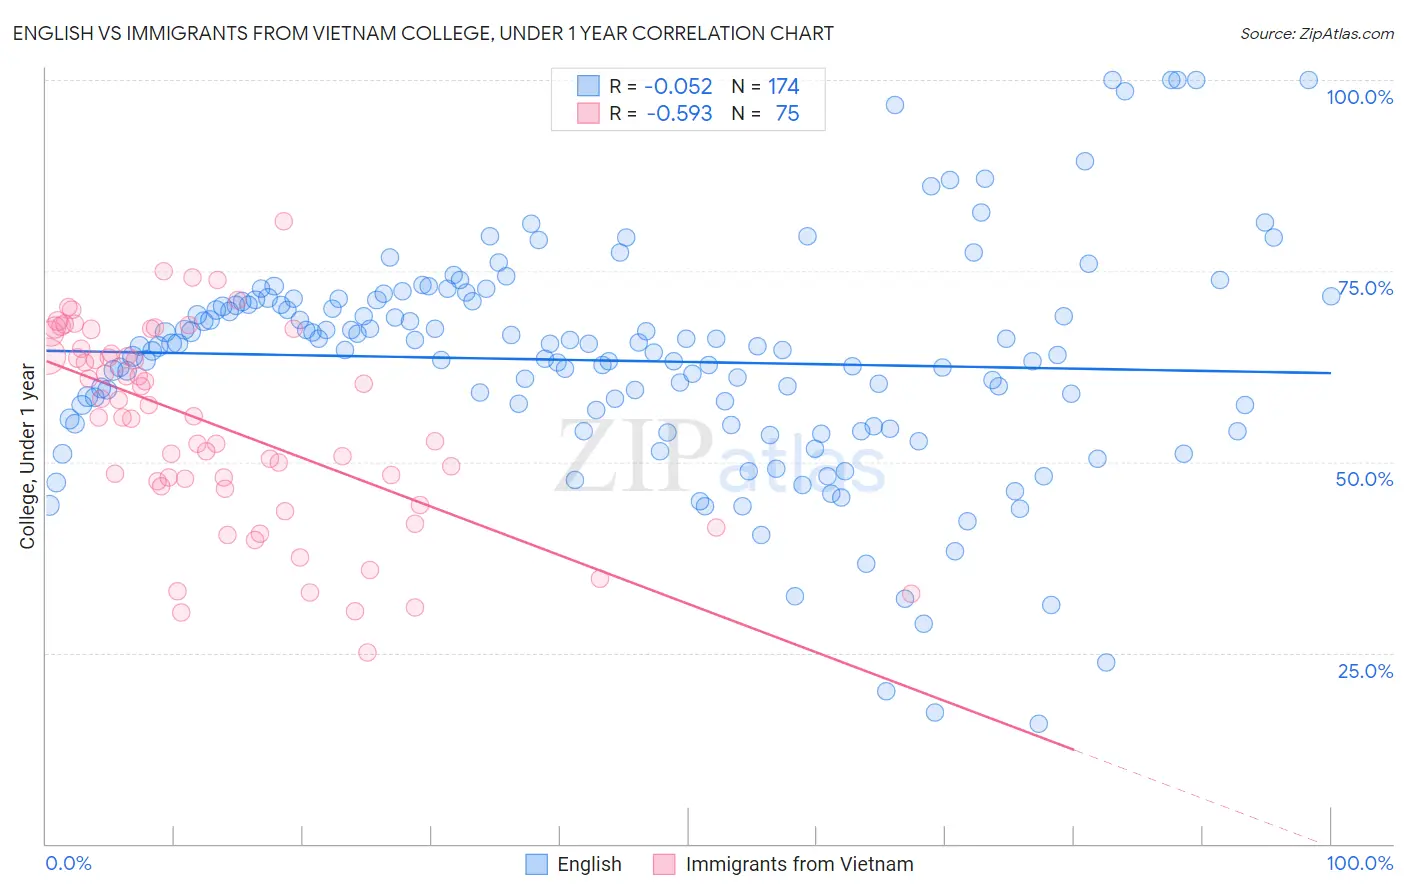
English vs Immigrants from Vietnam College, Under 1 year Correlation Chart
The statistical analysis conducted on geographies consisting of 579,966,424 people shows a slight negative correlation between the proportion of English and percentage of population with at least college, under 1 year education in the United States with a correlation coefficient (R) of -0.052 and weighted average of 66.6%. Similarly, the statistical analysis conducted on geographies consisting of 404,840,202 people shows a substantial negative correlation between the proportion of Immigrants from Vietnam and percentage of population with at least college, under 1 year education in the United States with a correlation coefficient (R) of -0.593 and weighted average of 64.0%, a difference of 4.0%.
College, Under 1 year Correlation Summary
| Measurement | English | Immigrants from Vietnam |
| Minimum | 15.7% | 25.0% |
| Maximum | 100.0% | 81.5% |
| Range | 84.3% | 56.5% |
| Mean | 63.3% | 54.8% |
| Median | 64.9% | 56.0% |
| Interquartile 25% (IQ1) | 55.0% | 46.8% |
| Interquartile 75% (IQ3) | 71.0% | 64.8% |
| Interquartile Range (IQR) | 16.0% | 17.9% |
| Standard Deviation (Sample) | 14.9% | 12.9% |
| Standard Deviation (Population) | 14.8% | 12.8% |
Similar Demographics by College, Under 1 year
Demographics Similar to English by College, Under 1 year
In terms of college, under 1 year, the demographic groups most similar to English are Immigrants from Uganda (66.5%, a difference of 0.010%), Immigrants from Germany (66.5%, a difference of 0.070%), Immigrants from Kenya (66.5%, a difference of 0.090%), Kenyan (66.5%, a difference of 0.090%), and Immigrants from Morocco (66.5%, a difference of 0.090%).
| Demographics | Rating | Rank | College, Under 1 year |
| Canadians | 87.9 /100 | #135 | Excellent 66.8% |
| Ugandans | 87.8 /100 | #136 | Excellent 66.8% |
| Immigrants | Chile | 87.4 /100 | #137 | Excellent 66.8% |
| Immigrants | Italy | 86.9 /100 | #138 | Excellent 66.8% |
| Venezuelans | 85.9 /100 | #139 | Excellent 66.7% |
| Slavs | 85.9 /100 | #140 | Excellent 66.7% |
| Immigrants | Afghanistan | 85.1 /100 | #141 | Excellent 66.7% |
| English | 82.9 /100 | #142 | Excellent 66.6% |
| Immigrants | Uganda | 82.8 /100 | #143 | Excellent 66.5% |
| Immigrants | Germany | 82.0 /100 | #144 | Excellent 66.5% |
| Immigrants | Kenya | 81.8 /100 | #145 | Excellent 66.5% |
| Kenyans | 81.7 /100 | #146 | Excellent 66.5% |
| Immigrants | Morocco | 81.7 /100 | #147 | Excellent 66.5% |
| Taiwanese | 78.6 /100 | #148 | Good 66.4% |
| Immigrants | Venezuela | 77.9 /100 | #149 | Good 66.3% |
Demographics Similar to Immigrants from Vietnam by College, Under 1 year
In terms of college, under 1 year, the demographic groups most similar to Immigrants from Vietnam are Colombian (64.0%, a difference of 0.030%), White/Caucasian (64.0%, a difference of 0.070%), Puget Sound Salish (63.9%, a difference of 0.090%), Ghanaian (63.9%, a difference of 0.10%), and Peruvian (64.1%, a difference of 0.16%).
| Demographics | Rating | Rank | College, Under 1 year |
| French Canadians | 16.3 /100 | #201 | Poor 64.2% |
| South Americans | 16.2 /100 | #202 | Poor 64.2% |
| Uruguayans | 15.6 /100 | #203 | Poor 64.2% |
| Immigrants | Zaire | 14.6 /100 | #204 | Poor 64.1% |
| Peruvians | 13.7 /100 | #205 | Poor 64.1% |
| Whites/Caucasians | 12.8 /100 | #206 | Poor 64.0% |
| Colombians | 12.4 /100 | #207 | Poor 64.0% |
| Immigrants | Vietnam | 12.1 /100 | #208 | Poor 64.0% |
| Puget Sound Salish | 11.3 /100 | #209 | Poor 63.9% |
| Ghanaians | 11.2 /100 | #210 | Poor 63.9% |
| Native Hawaiians | 10.6 /100 | #211 | Poor 63.9% |
| Immigrants | Middle Africa | 10.5 /100 | #212 | Poor 63.9% |
| Immigrants | South America | 9.1 /100 | #213 | Tragic 63.8% |
| Immigrants | Nigeria | 8.8 /100 | #214 | Tragic 63.7% |
| Senegalese | 7.7 /100 | #215 | Tragic 63.6% |