Zimbabwean vs Immigrants from Vietnam College, Under 1 year
COMPARE
Zimbabwean
Immigrants from Vietnam
College, Under 1 year
College, Under 1 year Comparison
Zimbabweans
Immigrants from Vietnam
69.9%
COLLEGE, UNDER 1 YEAR
99.8/ 100
METRIC RATING
50th/ 347
METRIC RANK
64.0%
COLLEGE, UNDER 1 YEAR
12.1/ 100
METRIC RATING
208th/ 347
METRIC RANK
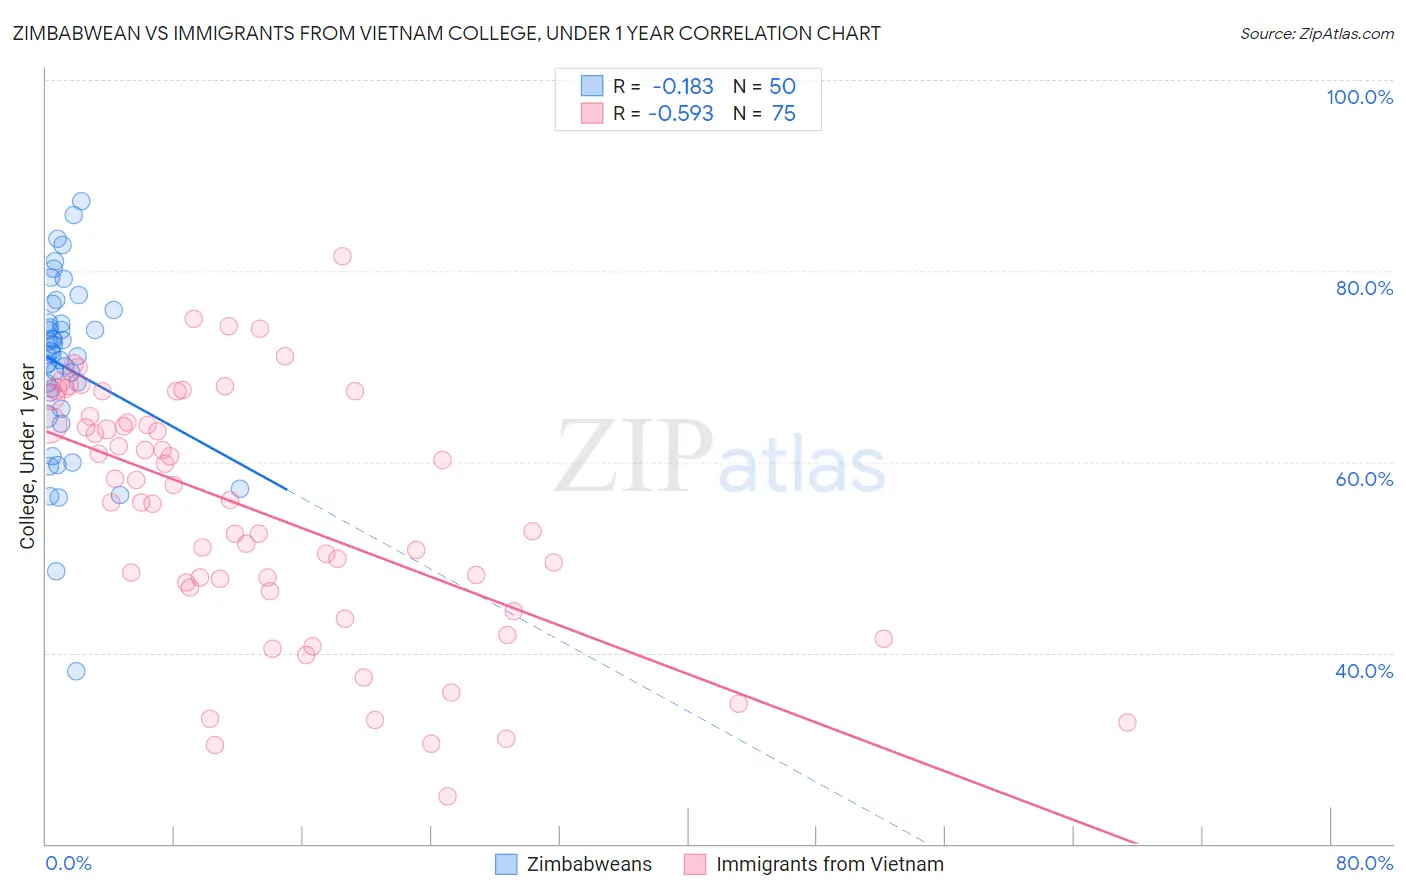
Zimbabwean vs Immigrants from Vietnam College, Under 1 year Correlation Chart
The statistical analysis conducted on geographies consisting of 69,203,226 people shows a poor negative correlation between the proportion of Zimbabweans and percentage of population with at least college, under 1 year education in the United States with a correlation coefficient (R) of -0.183 and weighted average of 69.9%. Similarly, the statistical analysis conducted on geographies consisting of 404,840,202 people shows a substantial negative correlation between the proportion of Immigrants from Vietnam and percentage of population with at least college, under 1 year education in the United States with a correlation coefficient (R) of -0.593 and weighted average of 64.0%, a difference of 9.2%.
College, Under 1 year Correlation Summary
| Measurement | Zimbabwean | Immigrants from Vietnam |
| Minimum | 38.0% | 25.0% |
| Maximum | 87.3% | 81.5% |
| Range | 49.3% | 56.5% |
| Mean | 69.9% | 54.8% |
| Median | 71.3% | 56.0% |
| Interquartile 25% (IQ1) | 65.6% | 46.8% |
| Interquartile 75% (IQ3) | 74.6% | 64.8% |
| Interquartile Range (IQR) | 9.0% | 17.9% |
| Standard Deviation (Sample) | 9.4% | 12.9% |
| Standard Deviation (Population) | 9.3% | 12.8% |
Similar Demographics by College, Under 1 year
Demographics Similar to Zimbabweans by College, Under 1 year
In terms of college, under 1 year, the demographic groups most similar to Zimbabweans are Mongolian (69.9%, a difference of 0.040%), Immigrants from Russia (69.9%, a difference of 0.060%), Immigrants from Austria (70.0%, a difference of 0.12%), Immigrants from Netherlands (70.0%, a difference of 0.16%), and Immigrants from Bulgaria (70.0%, a difference of 0.22%).
| Demographics | Rating | Rank | College, Under 1 year |
| Israelis | 99.9 /100 | #43 | Exceptional 70.2% |
| New Zealanders | 99.9 /100 | #44 | Exceptional 70.2% |
| Immigrants | Norway | 99.9 /100 | #45 | Exceptional 70.2% |
| Immigrants | Latvia | 99.9 /100 | #46 | Exceptional 70.1% |
| Immigrants | Bulgaria | 99.8 /100 | #47 | Exceptional 70.0% |
| Immigrants | Netherlands | 99.8 /100 | #48 | Exceptional 70.0% |
| Immigrants | Austria | 99.8 /100 | #49 | Exceptional 70.0% |
| Zimbabweans | 99.8 /100 | #50 | Exceptional 69.9% |
| Mongolians | 99.8 /100 | #51 | Exceptional 69.9% |
| Immigrants | Russia | 99.8 /100 | #52 | Exceptional 69.9% |
| South Africans | 99.7 /100 | #53 | Exceptional 69.7% |
| Immigrants | Czechoslovakia | 99.7 /100 | #54 | Exceptional 69.6% |
| Maltese | 99.7 /100 | #55 | Exceptional 69.5% |
| Immigrants | Scotland | 99.6 /100 | #56 | Exceptional 69.4% |
| Asians | 99.6 /100 | #57 | Exceptional 69.4% |
Demographics Similar to Immigrants from Vietnam by College, Under 1 year
In terms of college, under 1 year, the demographic groups most similar to Immigrants from Vietnam are Colombian (64.0%, a difference of 0.030%), White/Caucasian (64.0%, a difference of 0.070%), Puget Sound Salish (63.9%, a difference of 0.090%), Ghanaian (63.9%, a difference of 0.10%), and Peruvian (64.1%, a difference of 0.16%).
| Demographics | Rating | Rank | College, Under 1 year |
| French Canadians | 16.3 /100 | #201 | Poor 64.2% |
| South Americans | 16.2 /100 | #202 | Poor 64.2% |
| Uruguayans | 15.6 /100 | #203 | Poor 64.2% |
| Immigrants | Zaire | 14.6 /100 | #204 | Poor 64.1% |
| Peruvians | 13.7 /100 | #205 | Poor 64.1% |
| Whites/Caucasians | 12.8 /100 | #206 | Poor 64.0% |
| Colombians | 12.4 /100 | #207 | Poor 64.0% |
| Immigrants | Vietnam | 12.1 /100 | #208 | Poor 64.0% |
| Puget Sound Salish | 11.3 /100 | #209 | Poor 63.9% |
| Ghanaians | 11.2 /100 | #210 | Poor 63.9% |
| Native Hawaiians | 10.6 /100 | #211 | Poor 63.9% |
| Immigrants | Middle Africa | 10.5 /100 | #212 | Poor 63.9% |
| Immigrants | South America | 9.1 /100 | #213 | Tragic 63.8% |
| Immigrants | Nigeria | 8.8 /100 | #214 | Tragic 63.7% |
| Senegalese | 7.7 /100 | #215 | Tragic 63.6% |