Immigrants from Congo vs Palestinian GED/Equivalency
COMPARE
Immigrants from Congo
Palestinian
GED/Equivalency
GED/Equivalency Comparison
Immigrants from Congo
Palestinians
83.1%
GED/EQUIVALENCY
0.2/ 100
METRIC RATING
263rd/ 347
METRIC RANK
87.3%
GED/EQUIVALENCY
96.8/ 100
METRIC RATING
100th/ 347
METRIC RANK
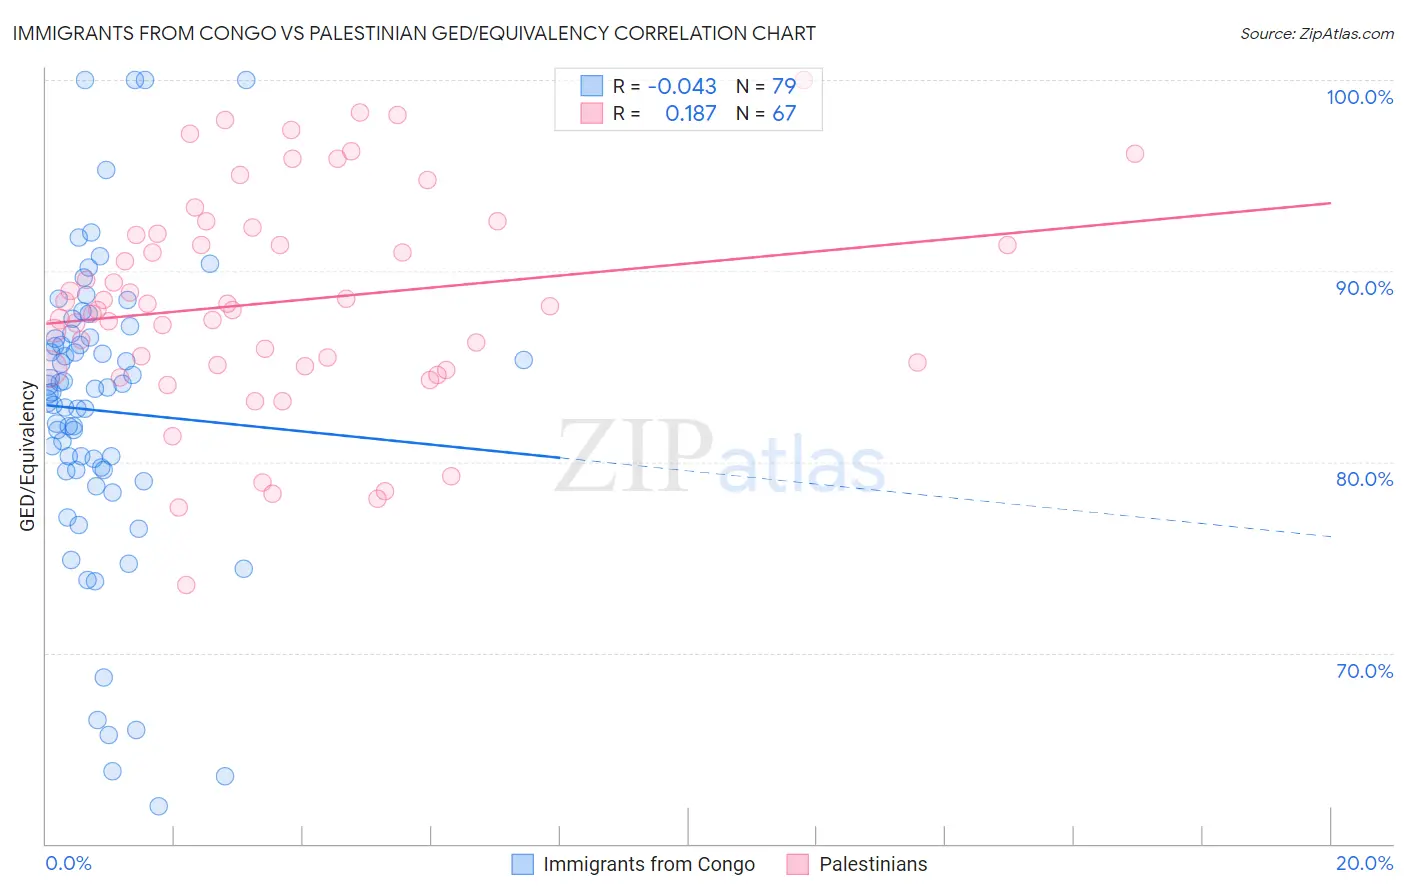
Immigrants from Congo vs Palestinian GED/Equivalency Correlation Chart
The statistical analysis conducted on geographies consisting of 92,095,910 people shows no correlation between the proportion of Immigrants from Congo and percentage of population with at least ged/equivalency education in the United States with a correlation coefficient (R) of -0.043 and weighted average of 83.1%. Similarly, the statistical analysis conducted on geographies consisting of 216,461,770 people shows a poor positive correlation between the proportion of Palestinians and percentage of population with at least ged/equivalency education in the United States with a correlation coefficient (R) of 0.187 and weighted average of 87.3%, a difference of 5.0%.
GED/Equivalency Correlation Summary
| Measurement | Immigrants from Congo | Palestinian |
| Minimum | 62.0% | 73.5% |
| Maximum | 100.0% | 100.0% |
| Range | 38.0% | 26.5% |
| Mean | 82.7% | 88.4% |
| Median | 83.7% | 88.2% |
| Interquartile 25% (IQ1) | 79.5% | 85.0% |
| Interquartile 75% (IQ3) | 86.5% | 92.0% |
| Interquartile Range (IQR) | 7.0% | 7.0% |
| Standard Deviation (Sample) | 7.9% | 5.7% |
| Standard Deviation (Population) | 7.8% | 5.6% |
Similar Demographics by GED/Equivalency
Demographics Similar to Immigrants from Congo by GED/Equivalency
In terms of ged/equivalency, the demographic groups most similar to Immigrants from Congo are Inupiat (83.1%, a difference of 0.010%), Immigrants from Armenia (83.1%, a difference of 0.010%), Bangladeshi (83.1%, a difference of 0.010%), West Indian (83.1%, a difference of 0.020%), and Kiowa (83.1%, a difference of 0.030%).
| Demographics | Rating | Rank | GED/Equivalency |
| Africans | 0.5 /100 | #256 | Tragic 83.4% |
| Jamaicans | 0.4 /100 | #257 | Tragic 83.3% |
| Malaysians | 0.4 /100 | #258 | Tragic 83.3% |
| Immigrants | Vietnam | 0.3 /100 | #259 | Tragic 83.2% |
| Choctaw | 0.3 /100 | #260 | Tragic 83.1% |
| Inupiat | 0.2 /100 | #261 | Tragic 83.1% |
| Immigrants | Armenia | 0.2 /100 | #262 | Tragic 83.1% |
| Immigrants | Congo | 0.2 /100 | #263 | Tragic 83.1% |
| Bangladeshis | 0.2 /100 | #264 | Tragic 83.1% |
| West Indians | 0.2 /100 | #265 | Tragic 83.1% |
| Kiowa | 0.2 /100 | #266 | Tragic 83.1% |
| Trinidadians and Tobagonians | 0.2 /100 | #267 | Tragic 83.0% |
| Immigrants | Burma/Myanmar | 0.2 /100 | #268 | Tragic 83.0% |
| Hopi | 0.2 /100 | #269 | Tragic 83.0% |
| Immigrants | Jamaica | 0.2 /100 | #270 | Tragic 82.9% |
Demographics Similar to Palestinians by GED/Equivalency
In terms of ged/equivalency, the demographic groups most similar to Palestinians are Immigrants from Belarus (87.3%, a difference of 0.020%), Immigrants from Croatia (87.3%, a difference of 0.030%), Syrian (87.2%, a difference of 0.030%), Immigrants from Western Europe (87.3%, a difference of 0.090%), and Lebanese (87.2%, a difference of 0.090%).
| Demographics | Rating | Rank | GED/Equivalency |
| Immigrants | North Macedonia | 97.8 /100 | #93 | Exceptional 87.4% |
| Immigrants | Russia | 97.8 /100 | #94 | Exceptional 87.4% |
| Immigrants | Greece | 97.7 /100 | #95 | Exceptional 87.4% |
| Czechoslovakians | 97.6 /100 | #96 | Exceptional 87.4% |
| Immigrants | Western Europe | 97.3 /100 | #97 | Exceptional 87.3% |
| Immigrants | Croatia | 96.9 /100 | #98 | Exceptional 87.3% |
| Immigrants | Belarus | 96.9 /100 | #99 | Exceptional 87.3% |
| Palestinians | 96.8 /100 | #100 | Exceptional 87.3% |
| Syrians | 96.6 /100 | #101 | Exceptional 87.2% |
| Lebanese | 96.2 /100 | #102 | Exceptional 87.2% |
| Jordanians | 96.1 /100 | #103 | Exceptional 87.2% |
| Immigrants | Hungary | 96.0 /100 | #104 | Exceptional 87.2% |
| Indians (Asian) | 95.9 /100 | #105 | Exceptional 87.1% |
| Immigrants | Zimbabwe | 95.8 /100 | #106 | Exceptional 87.1% |
| Icelanders | 95.7 /100 | #107 | Exceptional 87.1% |