Egyptian vs Palestinian GED/Equivalency
COMPARE
Egyptian
Palestinian
GED/Equivalency
GED/Equivalency Comparison
Egyptians
Palestinians
87.1%
GED/EQUIVALENCY
95.3/ 100
METRIC RATING
110th/ 347
METRIC RANK
87.3%
GED/EQUIVALENCY
96.8/ 100
METRIC RATING
100th/ 347
METRIC RANK
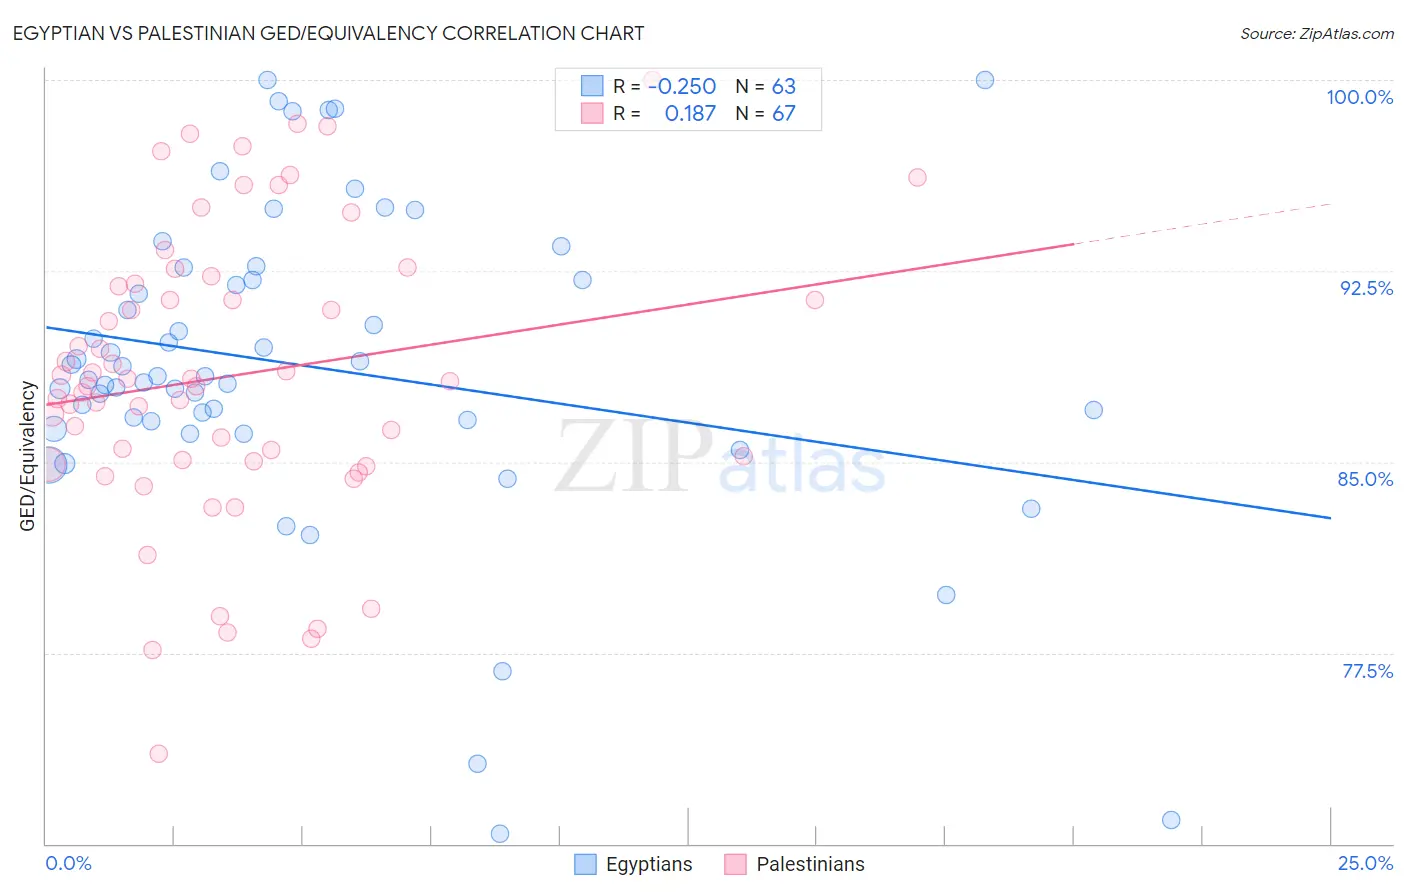
Egyptian vs Palestinian GED/Equivalency Correlation Chart
The statistical analysis conducted on geographies consisting of 276,927,519 people shows a weak negative correlation between the proportion of Egyptians and percentage of population with at least ged/equivalency education in the United States with a correlation coefficient (R) of -0.250 and weighted average of 87.1%. Similarly, the statistical analysis conducted on geographies consisting of 216,461,770 people shows a poor positive correlation between the proportion of Palestinians and percentage of population with at least ged/equivalency education in the United States with a correlation coefficient (R) of 0.187 and weighted average of 87.3%, a difference of 0.20%.
GED/Equivalency Correlation Summary
| Measurement | Egyptian | Palestinian |
| Minimum | 70.4% | 73.5% |
| Maximum | 100.0% | 100.0% |
| Range | 29.6% | 26.5% |
| Mean | 88.8% | 88.4% |
| Median | 88.3% | 88.2% |
| Interquartile 25% (IQ1) | 86.6% | 85.0% |
| Interquartile 75% (IQ3) | 92.2% | 92.0% |
| Interquartile Range (IQR) | 5.5% | 7.0% |
| Standard Deviation (Sample) | 6.2% | 5.7% |
| Standard Deviation (Population) | 6.1% | 5.6% |
Demographics Similar to Egyptians and Palestinians by GED/Equivalency
In terms of ged/equivalency, the demographic groups most similar to Egyptians are French (87.1%, a difference of 0.0%), Immigrants from Eastern Europe (87.1%, a difference of 0.030%), Canadian (87.1%, a difference of 0.040%), Icelander (87.1%, a difference of 0.050%), and Tlingit-Haida (87.0%, a difference of 0.050%). Similarly, the demographic groups most similar to Palestinians are Immigrants from Belarus (87.3%, a difference of 0.020%), Immigrants from Croatia (87.3%, a difference of 0.030%), Syrian (87.2%, a difference of 0.030%), Immigrants from Western Europe (87.3%, a difference of 0.090%), and Lebanese (87.2%, a difference of 0.090%).
| Demographics | Rating | Rank | GED/Equivalency |
| Immigrants | Greece | 97.7 /100 | #95 | Exceptional 87.4% |
| Czechoslovakians | 97.6 /100 | #96 | Exceptional 87.4% |
| Immigrants | Western Europe | 97.3 /100 | #97 | Exceptional 87.3% |
| Immigrants | Croatia | 96.9 /100 | #98 | Exceptional 87.3% |
| Immigrants | Belarus | 96.9 /100 | #99 | Exceptional 87.3% |
| Palestinians | 96.8 /100 | #100 | Exceptional 87.3% |
| Syrians | 96.6 /100 | #101 | Exceptional 87.2% |
| Lebanese | 96.2 /100 | #102 | Exceptional 87.2% |
| Jordanians | 96.1 /100 | #103 | Exceptional 87.2% |
| Immigrants | Hungary | 96.0 /100 | #104 | Exceptional 87.2% |
| Indians (Asian) | 95.9 /100 | #105 | Exceptional 87.1% |
| Immigrants | Zimbabwe | 95.8 /100 | #106 | Exceptional 87.1% |
| Icelanders | 95.7 /100 | #107 | Exceptional 87.1% |
| Canadians | 95.6 /100 | #108 | Exceptional 87.1% |
| Immigrants | Eastern Europe | 95.5 /100 | #109 | Exceptional 87.1% |
| Egyptians | 95.3 /100 | #110 | Exceptional 87.1% |
| French | 95.2 /100 | #111 | Exceptional 87.1% |
| Tlingit-Haida | 94.8 /100 | #112 | Exceptional 87.0% |
| Assyrians/Chaldeans/Syriacs | 94.8 /100 | #113 | Exceptional 87.0% |
| Immigrants | Kazakhstan | 94.7 /100 | #114 | Exceptional 87.0% |
| Mongolians | 94.6 /100 | #115 | Exceptional 87.0% |