Immigrants from Congo vs Immigrants from Eastern Africa GED/Equivalency

COMPARE

Immigrants from Congo
Race
Ancestry
AfghanAfricanAlaska NativeAlaskan AthabascanAlbanianAleutAlsatianAmericanApacheArabArapahoArgentineanArmenianAssyrian/Chaldean/SyriacAustralianAustrianBahamianBangladeshiBarbadianBasqueBelgianBelizeanBermudanBhutaneseBlackfeetBolivianBrazilianBritishBritish West IndianBulgarianBurmeseCajunCambodianCanadianCape VerdeanCarpatho RusynCelticCentral AmericanCentral American IndianCherokeeCheyenneChickasawChileanChineseChippewaChoctawColombianColvilleComancheCosta RicanCreeCreekCroatianCrowCubanCypriotCzechCzechoslovakianDanishDelawareDominicanDutchDutch West IndianEastern EuropeanEcuadorianEgyptianEnglishEstonianEthiopianEuropeanFijianFilipinoFinnishFrenchFrench American IndianFrench CanadianGermanGerman RussianGhanaianGreekGuamanian/ChamorroGuatemalanGuyaneseHaitianHmongHonduranHopiHoumaHungarianIcelanderIndian (Asian)IndonesianInupiatIranianIraqiIrishIroquoisIsraeliItalianJamaicanJapaneseJordanianKenyanKiowaKoreanLaotianLatvianLebaneseLiberianLithuanianLumbeeLuxembourgerMacedonianMalaysianMalteseMarshalleseMenomineeMexicanMexican American IndianMongolianMoroccanNative HawaiianNavajoNepaleseNew ZealanderNicaraguanNigerianNorthern EuropeanNorwegianOkinawanOsageOttawaPaiutePakistaniPalestinianPanamanianParaguayanPennsylvania GermanPeruvianPimaPolishPortuguesePotawatomiPuebloPuerto RicanPuget Sound SalishRomanianRussianSalvadoranSamoanScandinavianScotch-IrishScottishSeminoleSenegaleseSerbianShoshoneSierra LeoneanSiouxSlavicSlovakSloveneSomaliSouth AfricanSouth AmericanSouth American IndianSoviet UnionSpaniardSpanishSpanish AmericanSpanish American IndianSri LankanSubsaharan AfricanSudaneseSwedishSwissSyrianTaiwaneseThaiTlingit-HaidaTohono O'OdhamTonganTrinidadian and TobagonianTsimshianTurkishU.S. Virgin IslanderUgandanUkrainianUruguayanUteVenezuelanVietnameseWelshWest IndianYakamaYaquiYugoslavianYumanYup'ikZimbabwean
Immigration
NonimmigrantsImmigrantsAfghanistanAfricaAlbaniaArgentinaArmeniaAsiaAustraliaAustriaBahamasBangladeshBarbadosBelarusBelgiumBelizeBoliviaBosnia and HerzegovinaBrazilBulgariaBurma/MyanmarCabo VerdeCambodiaCameroonCanadaCaribbeanCentral AmericaChileChinaColombiaCongoCosta RicaCroatiaCubaCzechoslovakiaDenmarkDominicaDominican RepublicEastern AsiaEastern EuropeEcuadorEgyptEl SalvadorEnglandEritreaEthiopiaEuropeFijiFranceGermanyGhanaGreeceGrenadaGuatemalaGuyanaHaitiHondurasHong KongHungaryIndiaIndonesiaIranIraqIrelandIsraelItalyJamaicaJapanJordanKazakhstanKenyaKoreaKuwaitLaosLatin AmericaLatviaLebanonLiberiaLithuaniaMalaysiaMexicoMicronesiaMiddle AfricaMoldovaMoroccoNepalNetherlandsNicaraguaNigeriaNorth AmericaNorth MacedoniaNorthern AfricaNorthern EuropeNorwayOceaniaPakistanPanamaPeruPhilippinesPolandPortugalRomaniaRussiaSaudi ArabiaScotlandSenegalSerbiaSierra LeoneSingaporeSomaliaSouth AfricaSouth AmericaSouth Central AsiaSouth Eastern AsiaSouthern EuropeSpainSri LankaSt. Vincent and the GrenadinesSudanSwedenSwitzerlandSyriaTaiwanThailandTrinidad and TobagoTurkeyUgandaUkraineUruguayUzbekistanVenezuelaVietnamWest IndiesWestern AfricaWestern AsiaWestern EuropeYemenZaireZimbabweAzores
Immigrants from Eastern Africa
Race
Ancestry
AfghanAfricanAlaska NativeAlaskan AthabascanAlbanianAleutAlsatianAmericanApacheArabArapahoArgentineanArmenianAssyrian/Chaldean/SyriacAustralianAustrianBahamianBangladeshiBarbadianBasqueBelgianBelizeanBermudanBhutaneseBlackfeetBolivianBrazilianBritishBritish West IndianBulgarianBurmeseCajunCambodianCanadianCape VerdeanCarpatho RusynCelticCentral AmericanCentral American IndianCherokeeCheyenneChickasawChileanChineseChippewaChoctawColombianColvilleComancheCosta RicanCreeCreekCroatianCrowCubanCypriotCzechCzechoslovakianDanishDelawareDominicanDutchDutch West IndianEastern EuropeanEcuadorianEgyptianEnglishEstonianEthiopianEuropeanFijianFilipinoFinnishFrenchFrench American IndianFrench CanadianGermanGerman RussianGhanaianGreekGuamanian/ChamorroGuatemalanGuyaneseHaitianHmongHonduranHopiHoumaHungarianIcelanderIndian (Asian)IndonesianInupiatIranianIraqiIrishIroquoisIsraeliItalianJamaicanJapaneseJordanianKenyanKiowaKoreanLaotianLatvianLebaneseLiberianLithuanianLumbeeLuxembourgerMacedonianMalaysianMalteseMarshalleseMenomineeMexicanMexican American IndianMongolianMoroccanNative HawaiianNavajoNepaleseNew ZealanderNicaraguanNigerianNorthern EuropeanNorwegianOkinawanOsageOttawaPaiutePakistaniPalestinianPanamanianParaguayanPennsylvania GermanPeruvianPimaPolishPortuguesePotawatomiPuebloPuerto RicanPuget Sound SalishRomanianRussianSalvadoranSamoanScandinavianScotch-IrishScottishSeminoleSenegaleseSerbianShoshoneSierra LeoneanSiouxSlavicSlovakSloveneSomaliSouth AfricanSouth AmericanSouth American IndianSoviet UnionSpaniardSpanishSpanish AmericanSpanish American IndianSri LankanSubsaharan AfricanSudaneseSwedishSwissSyrianTaiwaneseThaiTlingit-HaidaTohono O'OdhamTonganTrinidadian and TobagonianTsimshianTurkishU.S. Virgin IslanderUgandanUkrainianUruguayanUteVenezuelanVietnameseWelshWest IndianYakamaYaquiYugoslavianYumanYup'ikZimbabwean
Immigration
NonimmigrantsImmigrantsAfghanistanAfricaAlbaniaArgentinaArmeniaAsiaAustraliaAustriaBahamasBangladeshBarbadosBelarusBelgiumBelizeBoliviaBosnia and HerzegovinaBrazilBulgariaBurma/MyanmarCabo VerdeCambodiaCameroonCanadaCaribbeanCentral AmericaChileChinaColombiaCosta RicaCroatiaCubaCzechoslovakiaDenmarkDominicaDominican RepublicEastern AfricaEastern AsiaEastern EuropeEcuadorEgyptEl SalvadorEnglandEritreaEthiopiaEuropeFijiFranceGermanyGhanaGreeceGrenadaGuatemalaGuyanaHaitiHondurasHong KongHungaryIndiaIndonesiaIranIraqIrelandIsraelItalyJamaicaJapanJordanKazakhstanKenyaKoreaKuwaitLaosLatin AmericaLatviaLebanonLiberiaLithuaniaMalaysiaMexicoMicronesiaMiddle AfricaMoldovaMoroccoNepalNetherlandsNicaraguaNigeriaNorth AmericaNorth MacedoniaNorthern AfricaNorthern EuropeNorwayOceaniaPakistanPanamaPeruPhilippinesPolandPortugalRomaniaRussiaSaudi ArabiaScotlandSenegalSerbiaSierra LeoneSingaporeSomaliaSouth AfricaSouth AmericaSouth Central AsiaSouth Eastern AsiaSouthern EuropeSpainSri LankaSt. Vincent and the GrenadinesSudanSwedenSwitzerlandSyriaTaiwanThailandTrinidad and TobagoTurkeyUgandaUkraineUruguayUzbekistanVenezuelaVietnamWest IndiesWestern AfricaWestern AsiaWestern EuropeYemenZaireZimbabweAzores
GED/Equivalency
Income
Poverty
Unemployment
Labor Participation
Family Structure
Vehicle Availability
Education Level
Disability

GED/Equivalency Comparison

Immigrants from Congo

Immigrants from Eastern Africa

Tragic
Average
83.1%
GED/EQUIVALENCY
0.2/ 100
METRIC RATING
263rd/ 347
METRIC RANK
85.7%
GED/EQUIVALENCY
47.7/ 100
METRIC RATING
176th/ 347
METRIC RANK

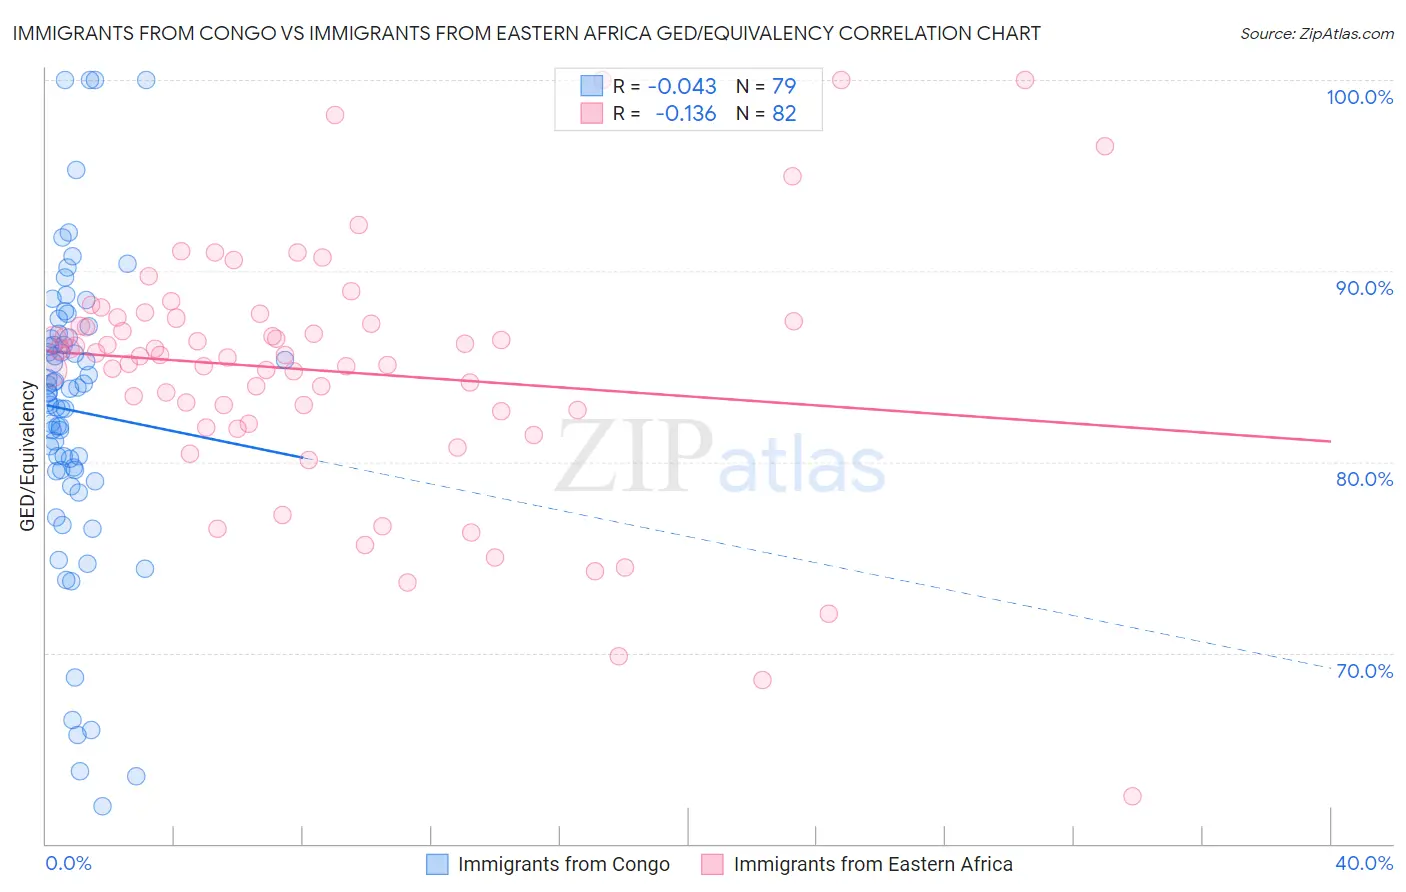
Immigrants from Congo vs Immigrants from Eastern Africa GED/Equivalency Correlation Chart

The statistical analysis conducted on geographies consisting of 92,095,910 people shows no correlation between the proportion of Immigrants from Congo and percentage of population with at least ged/equivalency education in the United States with a correlation coefficient (R) of -0.043 and weighted average of 83.1%. Similarly, the statistical analysis conducted on geographies consisting of 355,153,076 people shows a poor negative correlation between the proportion of Immigrants from Eastern Africa and percentage of population with at least ged/equivalency education in the United States with a correlation coefficient (R) of -0.136 and weighted average of 85.7%, a difference of 3.2%.
Immigrants from Congo vs Immigrants from Eastern Africa GED/Equivalency

GED/Equivalency Correlation Summary

MeasurementImmigrants from CongoImmigrants from Eastern Africa
Minimum62.0%62.5%
Maximum100.0%100.0%
Range38.0%37.5%
Mean82.7%84.7%
Median83.7%85.6%
Interquartile 25% (IQ1)79.5%82.7%
Interquartile 75% (IQ3)86.5%87.5%
Interquartile Range (IQR)7.0%4.9%
Standard Deviation (Sample)7.9%6.6%
Standard Deviation (Population)7.8%6.6%

Similar Demographics by GED/Equivalency

Demographics Similar to Immigrants from Congo by GED/Equivalency

In terms of ged/equivalency, the demographic groups most similar to Immigrants from Congo are Inupiat (83.1%, a difference of 0.010%), Immigrants from Armenia (83.1%, a difference of 0.010%), Bangladeshi (83.1%, a difference of 0.010%), West Indian (83.1%, a difference of 0.020%), and Kiowa (83.1%, a difference of 0.030%).
DemographicsRating | RankGED/Equivalency
Africans
0.5
/100
|
#256
Tragic
83.4%
Jamaicans
0.4
/100
|
#257
Tragic
83.3%
Malaysians
0.4
/100
|
#258
Tragic
83.3%
Immigrants | Vietnam
0.3
/100
|
#259
Tragic
83.2%
Choctaw
0.3
/100
|
#260
Tragic
83.1%
Inupiat
0.2
/100
|
#261
Tragic
83.1%
Immigrants | Armenia
0.2
/100
|
#262
Tragic
83.1%
Immigrants | Congo
0.2
/100
|
#263
Tragic
83.1%
Bangladeshis
0.2
/100
|
#264
Tragic
83.1%
West Indians
0.2
/100
|
#265
Tragic
83.1%
Kiowa
0.2
/100
|
#266
Tragic
83.1%
Trinidadians and Tobagonians
0.2
/100
|
#267
Tragic
83.0%
Immigrants | Burma/Myanmar
0.2
/100
|
#268
Tragic
83.0%
Hopi
0.2
/100
|
#269
Tragic
83.0%
Immigrants | Jamaica
0.2
/100
|
#270
Tragic
82.9%

Demographics Similar to Immigrants from Eastern Africa by GED/Equivalency

In terms of ged/equivalency, the demographic groups most similar to Immigrants from Eastern Africa are Immigrants from Bolivia (85.8%, a difference of 0.040%), Ottawa (85.8%, a difference of 0.050%), Immigrants from Uganda (85.7%, a difference of 0.050%), Immigrants from Venezuela (85.8%, a difference of 0.060%), and Korean (85.6%, a difference of 0.13%).
DemographicsRating | RankGED/Equivalency
Immigrants | Ethiopia
61.2
/100
|
#169
Good
86.0%
Afghans
59.7
/100
|
#170
Average
85.9%
Immigrants | Chile
57.3
/100
|
#171
Average
85.9%
Bermudans
55.1
/100
|
#172
Average
85.8%
Immigrants | Venezuela
50.7
/100
|
#173
Average
85.8%
Ottawa
50.0
/100
|
#174
Average
85.8%
Immigrants | Bolivia
49.8
/100
|
#175
Average
85.8%
Immigrants | Eastern Africa
47.7
/100
|
#176
Average
85.7%
Immigrants | Uganda
45.2
/100
|
#177
Average
85.7%
Koreans
41.2
/100
|
#178
Average
85.6%
Aleuts
40.5
/100
|
#179
Average
85.6%
Immigrants | Southern Europe
38.4
/100
|
#180
Fair
85.5%
Moroccans
37.7
/100
|
#181
Fair
85.5%
Sudanese
35.2
/100
|
#182
Fair
85.5%
Immigrants | Sudan
34.2
/100
|
#183
Fair
85.5%