British vs Palestinian GED/Equivalency
COMPARE
British
Palestinian
GED/Equivalency
GED/Equivalency Comparison
British
Palestinians
87.8%
GED/EQUIVALENCY
99.1/ 100
METRIC RATING
67th/ 347
METRIC RANK
87.3%
GED/EQUIVALENCY
96.8/ 100
METRIC RATING
100th/ 347
METRIC RANK
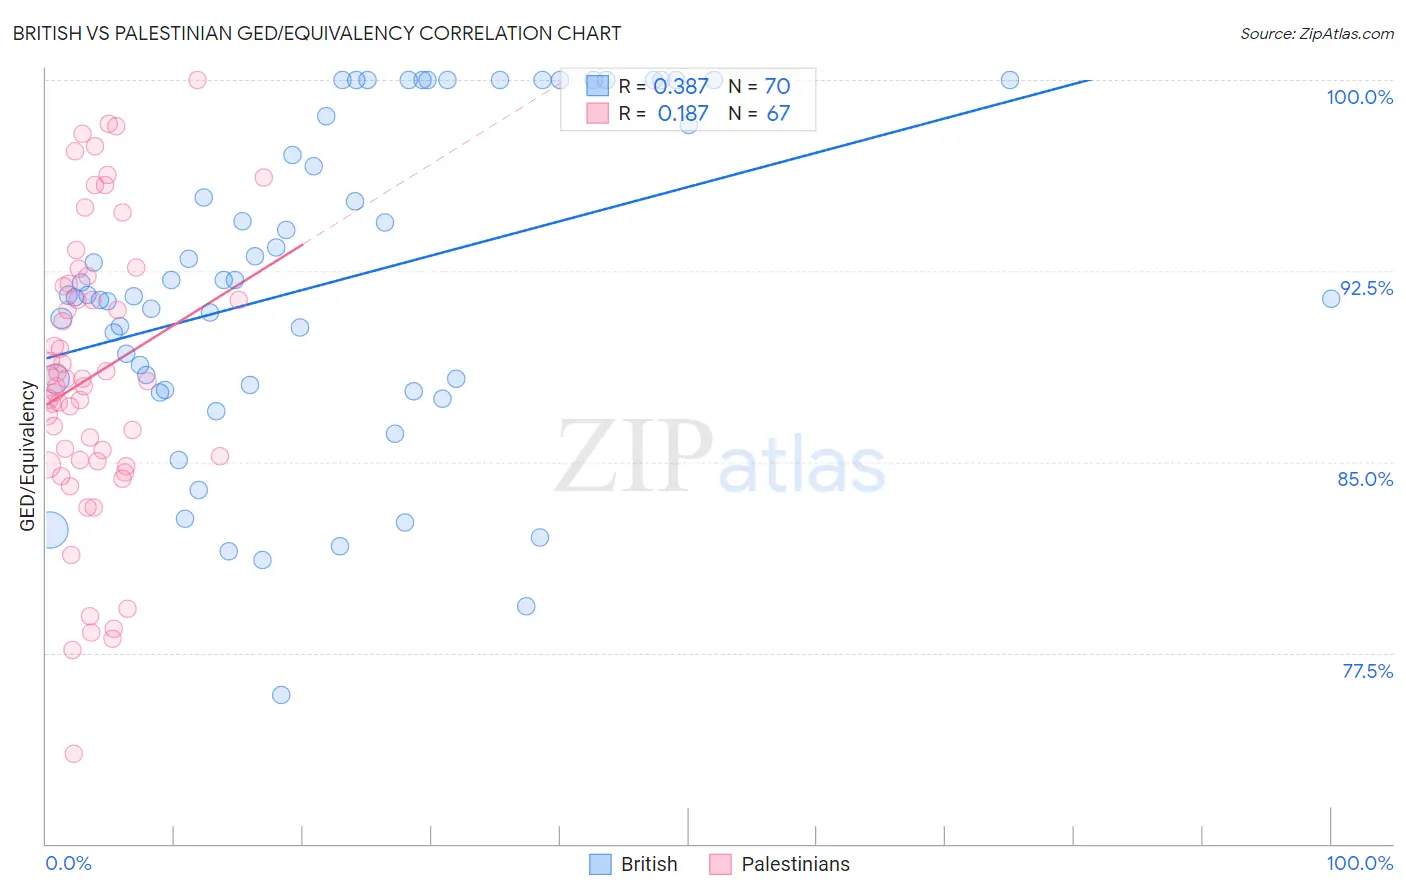
British vs Palestinian GED/Equivalency Correlation Chart
The statistical analysis conducted on geographies consisting of 531,463,395 people shows a mild positive correlation between the proportion of British and percentage of population with at least ged/equivalency education in the United States with a correlation coefficient (R) of 0.387 and weighted average of 87.8%. Similarly, the statistical analysis conducted on geographies consisting of 216,461,770 people shows a poor positive correlation between the proportion of Palestinians and percentage of population with at least ged/equivalency education in the United States with a correlation coefficient (R) of 0.187 and weighted average of 87.3%, a difference of 0.65%.
GED/Equivalency Correlation Summary
| Measurement | British | Palestinian |
| Minimum | 75.9% | 73.5% |
| Maximum | 100.0% | 100.0% |
| Range | 24.1% | 26.5% |
| Mean | 92.0% | 88.4% |
| Median | 91.5% | 88.2% |
| Interquartile 25% (IQ1) | 88.0% | 85.0% |
| Interquartile 75% (IQ3) | 98.6% | 92.0% |
| Interquartile Range (IQR) | 10.6% | 7.0% |
| Standard Deviation (Sample) | 6.3% | 5.7% |
| Standard Deviation (Population) | 6.2% | 5.6% |
Similar Demographics by GED/Equivalency
Demographics Similar to British by GED/Equivalency
In terms of ged/equivalency, the demographic groups most similar to British are Immigrants from France (87.8%, a difference of 0.0%), Immigrants from North America (87.8%, a difference of 0.010%), Immigrants from Bulgaria (87.8%, a difference of 0.010%), Immigrants from Canada (87.9%, a difference of 0.050%), and Immigrants from Saudi Arabia (87.8%, a difference of 0.070%).
| Demographics | Rating | Rank | GED/Equivalency |
| Scandinavians | 99.3 /100 | #60 | Exceptional 87.9% |
| Europeans | 99.3 /100 | #61 | Exceptional 87.9% |
| Germans | 99.3 /100 | #62 | Exceptional 87.9% |
| Immigrants | Turkey | 99.2 /100 | #63 | Exceptional 87.9% |
| Immigrants | Canada | 99.2 /100 | #64 | Exceptional 87.9% |
| Immigrants | North America | 99.1 /100 | #65 | Exceptional 87.8% |
| Immigrants | Bulgaria | 99.1 /100 | #66 | Exceptional 87.8% |
| British | 99.1 /100 | #67 | Exceptional 87.8% |
| Immigrants | France | 99.1 /100 | #68 | Exceptional 87.8% |
| Immigrants | Saudi Arabia | 99.0 /100 | #69 | Exceptional 87.8% |
| Ukrainians | 98.8 /100 | #70 | Exceptional 87.7% |
| Austrians | 98.8 /100 | #71 | Exceptional 87.7% |
| Immigrants | Moldova | 98.8 /100 | #72 | Exceptional 87.7% |
| Belgians | 98.8 /100 | #73 | Exceptional 87.7% |
| Immigrants | Kuwait | 98.8 /100 | #74 | Exceptional 87.7% |
Demographics Similar to Palestinians by GED/Equivalency
In terms of ged/equivalency, the demographic groups most similar to Palestinians are Immigrants from Belarus (87.3%, a difference of 0.020%), Immigrants from Croatia (87.3%, a difference of 0.030%), Syrian (87.2%, a difference of 0.030%), Immigrants from Western Europe (87.3%, a difference of 0.090%), and Lebanese (87.2%, a difference of 0.090%).
| Demographics | Rating | Rank | GED/Equivalency |
| Immigrants | North Macedonia | 97.8 /100 | #93 | Exceptional 87.4% |
| Immigrants | Russia | 97.8 /100 | #94 | Exceptional 87.4% |
| Immigrants | Greece | 97.7 /100 | #95 | Exceptional 87.4% |
| Czechoslovakians | 97.6 /100 | #96 | Exceptional 87.4% |
| Immigrants | Western Europe | 97.3 /100 | #97 | Exceptional 87.3% |
| Immigrants | Croatia | 96.9 /100 | #98 | Exceptional 87.3% |
| Immigrants | Belarus | 96.9 /100 | #99 | Exceptional 87.3% |
| Palestinians | 96.8 /100 | #100 | Exceptional 87.3% |
| Syrians | 96.6 /100 | #101 | Exceptional 87.2% |
| Lebanese | 96.2 /100 | #102 | Exceptional 87.2% |
| Jordanians | 96.1 /100 | #103 | Exceptional 87.2% |
| Immigrants | Hungary | 96.0 /100 | #104 | Exceptional 87.2% |
| Indians (Asian) | 95.9 /100 | #105 | Exceptional 87.1% |
| Immigrants | Zimbabwe | 95.8 /100 | #106 | Exceptional 87.1% |
| Icelanders | 95.7 /100 | #107 | Exceptional 87.1% |