Cree vs Immigrants from North Macedonia College, 1 year or more
COMPARE
Cree
Immigrants from North Macedonia
College, 1 year or more
College, 1 year or more Comparison
Cree
Immigrants from North Macedonia
56.8%
COLLEGE, 1 YEAR OR MORE
3.6/ 100
METRIC RATING
229th/ 347
METRIC RANK
59.5%
COLLEGE, 1 YEAR OR MORE
53.1/ 100
METRIC RATING
167th/ 347
METRIC RANK
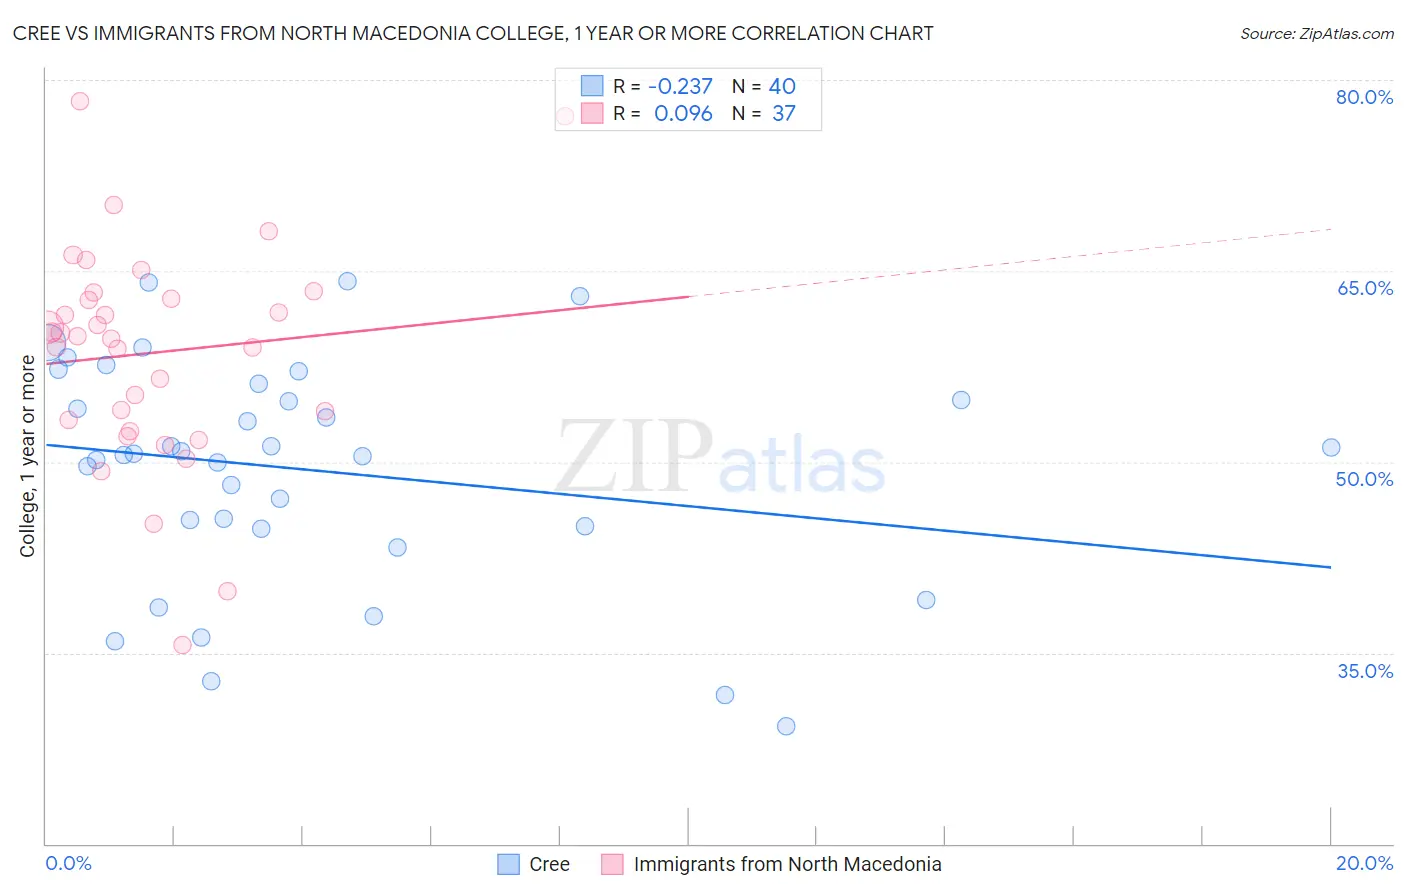
Cree vs Immigrants from North Macedonia College, 1 year or more Correlation Chart
The statistical analysis conducted on geographies consisting of 76,211,685 people shows a weak negative correlation between the proportion of Cree and percentage of population with at least college, 1 year or more education in the United States with a correlation coefficient (R) of -0.237 and weighted average of 56.8%. Similarly, the statistical analysis conducted on geographies consisting of 74,317,045 people shows a slight positive correlation between the proportion of Immigrants from North Macedonia and percentage of population with at least college, 1 year or more education in the United States with a correlation coefficient (R) of 0.096 and weighted average of 59.5%, a difference of 4.7%.
College, 1 year or more Correlation Summary
| Measurement | Cree | Immigrants from North Macedonia |
| Minimum | 29.2% | 35.6% |
| Maximum | 64.2% | 78.3% |
| Range | 35.0% | 42.7% |
| Mean | 49.3% | 58.6% |
| Median | 50.6% | 59.8% |
| Interquartile 25% (IQ1) | 44.8% | 52.8% |
| Interquartile 75% (IQ3) | 55.5% | 63.0% |
| Interquartile Range (IQR) | 10.7% | 10.2% |
| Standard Deviation (Sample) | 8.9% | 8.7% |
| Standard Deviation (Population) | 8.8% | 8.6% |
Similar Demographics by College, 1 year or more
Demographics Similar to Cree by College, 1 year or more
In terms of college, 1 year or more, the demographic groups most similar to Cree are Immigrants from Fiji (56.9%, a difference of 0.13%), Liberian (56.7%, a difference of 0.22%), Immigrants (57.0%, a difference of 0.28%), Immigrants from Western Africa (57.0%, a difference of 0.35%), and Vietnamese (57.0%, a difference of 0.37%).
| Demographics | Rating | Rank | College, 1 year or more |
| Sub-Saharan Africans | 6.1 /100 | #222 | Tragic 57.3% |
| Portuguese | 5.4 /100 | #223 | Tragic 57.2% |
| Hmong | 5.4 /100 | #224 | Tragic 57.2% |
| Vietnamese | 4.7 /100 | #225 | Tragic 57.0% |
| Immigrants | Western Africa | 4.6 /100 | #226 | Tragic 57.0% |
| Immigrants | Immigrants | 4.4 /100 | #227 | Tragic 57.0% |
| Immigrants | Fiji | 4.0 /100 | #228 | Tragic 56.9% |
| Cree | 3.6 /100 | #229 | Tragic 56.8% |
| Liberians | 3.1 /100 | #230 | Tragic 56.7% |
| Immigrants | Burma/Myanmar | 2.7 /100 | #231 | Tragic 56.6% |
| Immigrants | Bangladesh | 2.6 /100 | #232 | Tragic 56.6% |
| Immigrants | Nonimmigrants | 2.5 /100 | #233 | Tragic 56.5% |
| Spanish Americans | 1.8 /100 | #234 | Tragic 56.3% |
| West Indians | 1.8 /100 | #235 | Tragic 56.3% |
| Iroquois | 1.7 /100 | #236 | Tragic 56.2% |
Demographics Similar to Immigrants from North Macedonia by College, 1 year or more
In terms of college, 1 year or more, the demographic groups most similar to Immigrants from North Macedonia are Hungarian (59.5%, a difference of 0.010%), Immigrants from Southern Europe (59.5%, a difference of 0.020%), Welsh (59.5%, a difference of 0.040%), Immigrants from Albania (59.5%, a difference of 0.040%), and Immigrants from Sierra Leone (59.5%, a difference of 0.050%).
| Demographics | Rating | Rank | College, 1 year or more |
| South American Indians | 66.9 /100 | #160 | Good 60.0% |
| Somalis | 64.5 /100 | #161 | Good 59.9% |
| Koreans | 58.5 /100 | #162 | Average 59.7% |
| Immigrants | Somalia | 58.3 /100 | #163 | Average 59.7% |
| Belgians | 58.1 /100 | #164 | Average 59.7% |
| Irish | 56.1 /100 | #165 | Average 59.6% |
| Immigrants | Africa | 56.1 /100 | #166 | Average 59.6% |
| Immigrants | North Macedonia | 53.1 /100 | #167 | Average 59.5% |
| Hungarians | 52.9 /100 | #168 | Average 59.5% |
| Immigrants | Southern Europe | 52.7 /100 | #169 | Average 59.5% |
| Welsh | 52.4 /100 | #170 | Average 59.5% |
| Immigrants | Albania | 52.3 /100 | #171 | Average 59.5% |
| Immigrants | Sierra Leone | 52.2 /100 | #172 | Average 59.5% |
| Immigrants | Oceania | 51.2 /100 | #173 | Average 59.4% |
| Celtics | 50.0 /100 | #174 | Average 59.4% |