Indian (Asian) vs Immigrants from North Macedonia College, 1 year or more
COMPARE
Indian (Asian)
Immigrants from North Macedonia
College, 1 year or more
College, 1 year or more Comparison
Indians (Asian)
Immigrants from North Macedonia
66.1%
COLLEGE, 1 YEAR OR MORE
100.0/ 100
METRIC RATING
25th/ 347
METRIC RANK
59.5%
COLLEGE, 1 YEAR OR MORE
53.1/ 100
METRIC RATING
167th/ 347
METRIC RANK
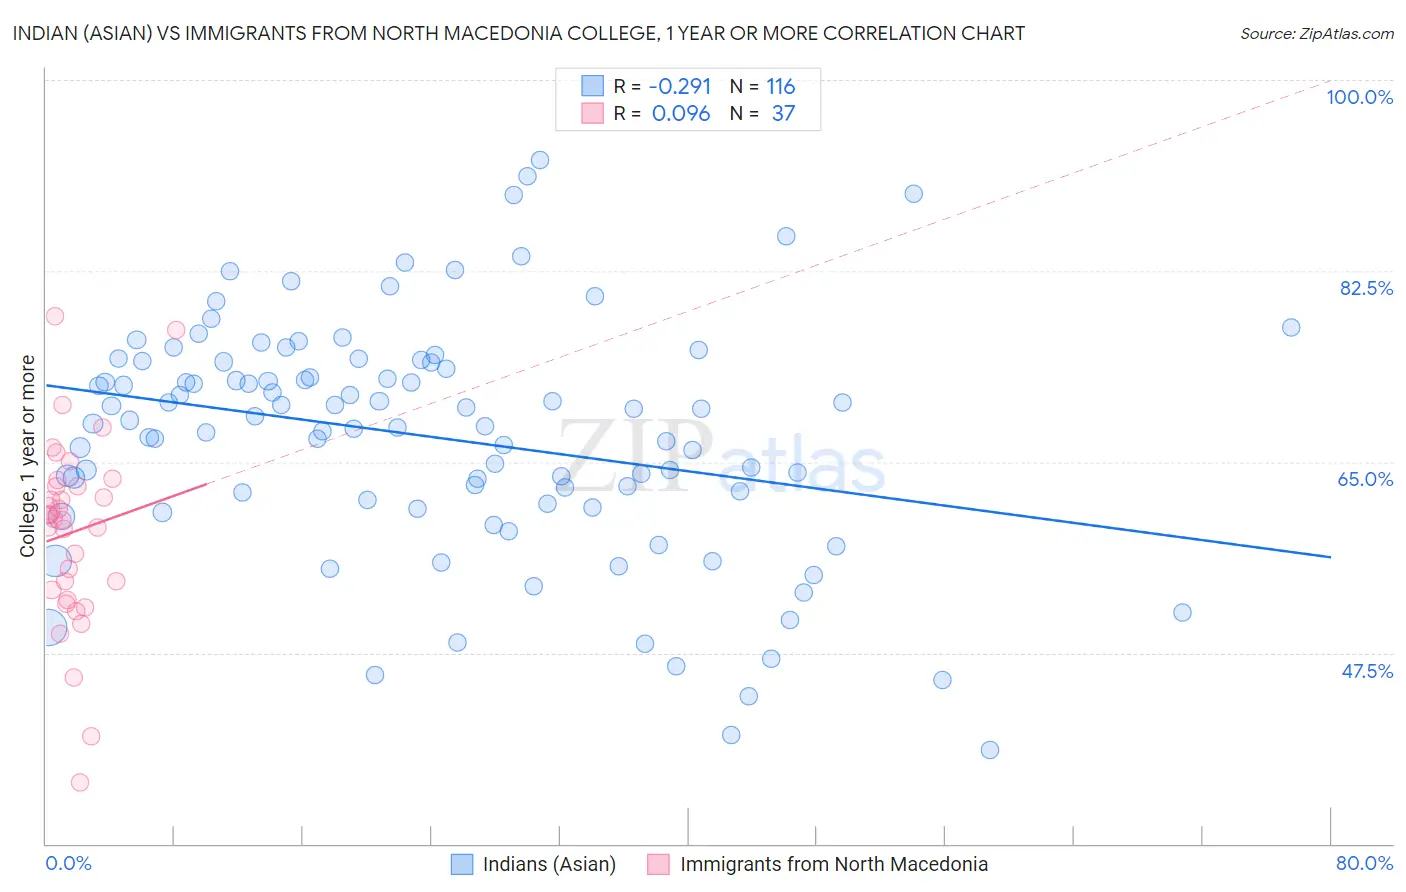
Indian (Asian) vs Immigrants from North Macedonia College, 1 year or more Correlation Chart
The statistical analysis conducted on geographies consisting of 495,342,032 people shows a weak negative correlation between the proportion of Indians (Asian) and percentage of population with at least college, 1 year or more education in the United States with a correlation coefficient (R) of -0.291 and weighted average of 66.1%. Similarly, the statistical analysis conducted on geographies consisting of 74,317,045 people shows a slight positive correlation between the proportion of Immigrants from North Macedonia and percentage of population with at least college, 1 year or more education in the United States with a correlation coefficient (R) of 0.096 and weighted average of 59.5%, a difference of 11.1%.
College, 1 year or more Correlation Summary
| Measurement | Indian (Asian) | Immigrants from North Macedonia |
| Minimum | 38.6% | 35.6% |
| Maximum | 92.7% | 78.3% |
| Range | 54.1% | 42.7% |
| Mean | 67.3% | 58.6% |
| Median | 68.7% | 59.8% |
| Interquartile 25% (IQ1) | 61.3% | 52.8% |
| Interquartile 75% (IQ3) | 74.1% | 63.0% |
| Interquartile Range (IQR) | 12.8% | 10.2% |
| Standard Deviation (Sample) | 10.8% | 8.7% |
| Standard Deviation (Population) | 10.8% | 8.6% |
Similar Demographics by College, 1 year or more
Demographics Similar to Indians (Asian) by College, 1 year or more
In terms of college, 1 year or more, the demographic groups most similar to Indians (Asian) are Latvian (66.1%, a difference of 0.040%), Immigrants from Ireland (65.9%, a difference of 0.24%), Immigrants from Belgium (66.3%, a difference of 0.35%), Immigrants from France (65.8%, a difference of 0.41%), and Immigrants from China (66.4%, a difference of 0.43%).
| Demographics | Rating | Rank | College, 1 year or more |
| Eastern Europeans | 100.0 /100 | #18 | Exceptional 66.6% |
| Immigrants | Switzerland | 100.0 /100 | #19 | Exceptional 66.5% |
| Immigrants | Korea | 100.0 /100 | #20 | Exceptional 66.5% |
| Immigrants | Hong Kong | 100.0 /100 | #21 | Exceptional 66.4% |
| Soviet Union | 100.0 /100 | #22 | Exceptional 66.4% |
| Immigrants | China | 100.0 /100 | #23 | Exceptional 66.4% |
| Immigrants | Belgium | 100.0 /100 | #24 | Exceptional 66.3% |
| Indians (Asian) | 100.0 /100 | #25 | Exceptional 66.1% |
| Latvians | 100.0 /100 | #26 | Exceptional 66.1% |
| Immigrants | Ireland | 100.0 /100 | #27 | Exceptional 65.9% |
| Immigrants | France | 100.0 /100 | #28 | Exceptional 65.8% |
| Immigrants | Northern Europe | 100.0 /100 | #29 | Exceptional 65.6% |
| Immigrants | Denmark | 100.0 /100 | #30 | Exceptional 65.6% |
| Turks | 100.0 /100 | #31 | Exceptional 65.5% |
| Bulgarians | 100.0 /100 | #32 | Exceptional 65.5% |
Demographics Similar to Immigrants from North Macedonia by College, 1 year or more
In terms of college, 1 year or more, the demographic groups most similar to Immigrants from North Macedonia are Hungarian (59.5%, a difference of 0.010%), Immigrants from Southern Europe (59.5%, a difference of 0.020%), Welsh (59.5%, a difference of 0.040%), Immigrants from Albania (59.5%, a difference of 0.040%), and Immigrants from Sierra Leone (59.5%, a difference of 0.050%).
| Demographics | Rating | Rank | College, 1 year or more |
| South American Indians | 66.9 /100 | #160 | Good 60.0% |
| Somalis | 64.5 /100 | #161 | Good 59.9% |
| Koreans | 58.5 /100 | #162 | Average 59.7% |
| Immigrants | Somalia | 58.3 /100 | #163 | Average 59.7% |
| Belgians | 58.1 /100 | #164 | Average 59.7% |
| Irish | 56.1 /100 | #165 | Average 59.6% |
| Immigrants | Africa | 56.1 /100 | #166 | Average 59.6% |
| Immigrants | North Macedonia | 53.1 /100 | #167 | Average 59.5% |
| Hungarians | 52.9 /100 | #168 | Average 59.5% |
| Immigrants | Southern Europe | 52.7 /100 | #169 | Average 59.5% |
| Welsh | 52.4 /100 | #170 | Average 59.5% |
| Immigrants | Albania | 52.3 /100 | #171 | Average 59.5% |
| Immigrants | Sierra Leone | 52.2 /100 | #172 | Average 59.5% |
| Immigrants | Oceania | 51.2 /100 | #173 | Average 59.4% |
| Celtics | 50.0 /100 | #174 | Average 59.4% |