Immigrants from Yemen vs Immigrants from North Macedonia College, 1 year or more
COMPARE
Immigrants from Yemen
Immigrants from North Macedonia
College, 1 year or more
College, 1 year or more Comparison
Immigrants from Yemen
Immigrants from North Macedonia
50.0%
COLLEGE, 1 YEAR OR MORE
0.0/ 100
METRIC RATING
331st/ 347
METRIC RANK
59.5%
COLLEGE, 1 YEAR OR MORE
53.1/ 100
METRIC RATING
167th/ 347
METRIC RANK
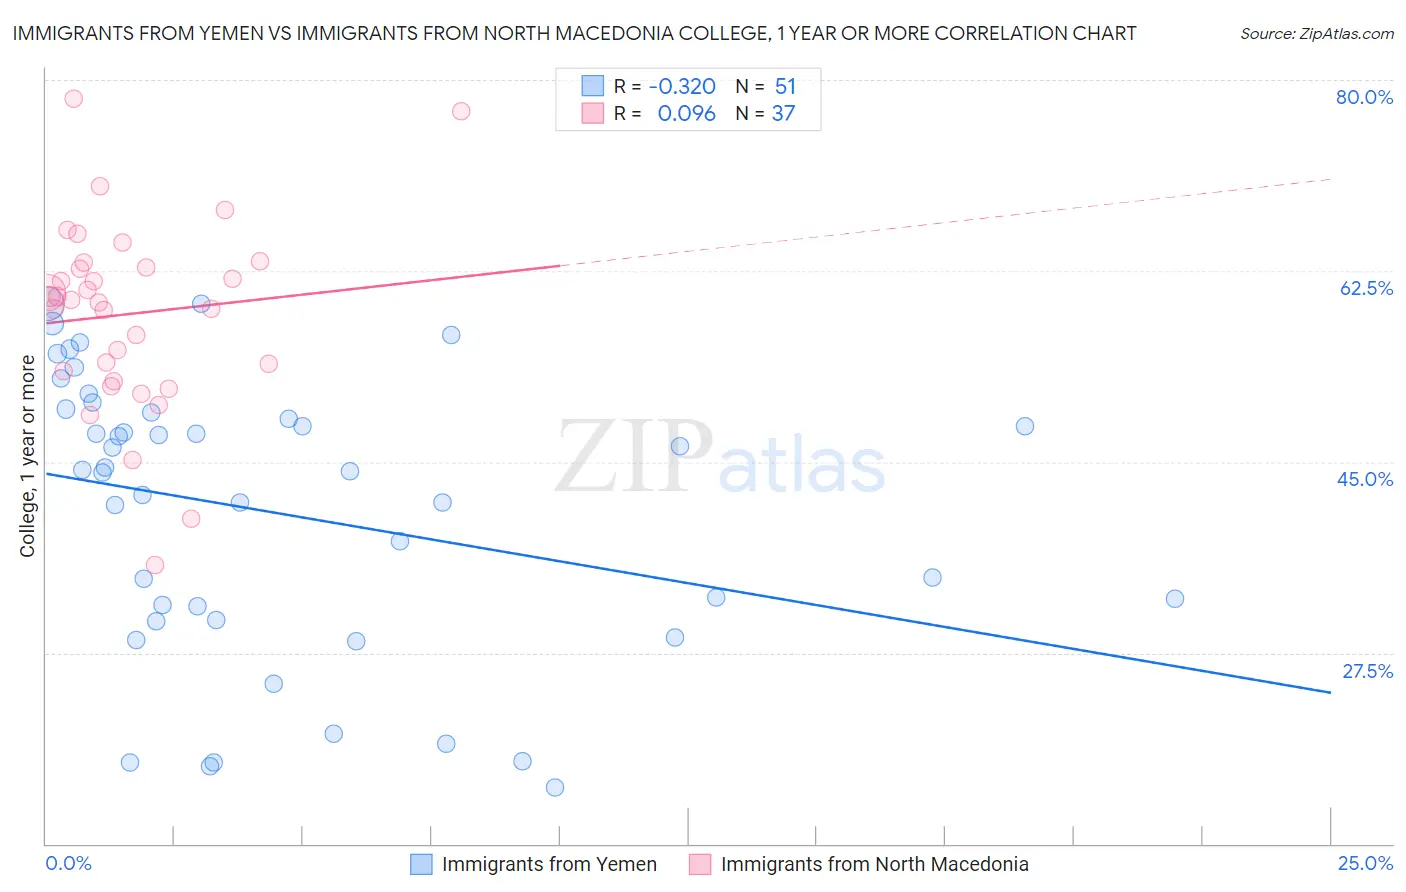
Immigrants from Yemen vs Immigrants from North Macedonia College, 1 year or more Correlation Chart
The statistical analysis conducted on geographies consisting of 82,433,611 people shows a mild negative correlation between the proportion of Immigrants from Yemen and percentage of population with at least college, 1 year or more education in the United States with a correlation coefficient (R) of -0.320 and weighted average of 50.0%. Similarly, the statistical analysis conducted on geographies consisting of 74,317,045 people shows a slight positive correlation between the proportion of Immigrants from North Macedonia and percentage of population with at least college, 1 year or more education in the United States with a correlation coefficient (R) of 0.096 and weighted average of 59.5%, a difference of 19.0%.
College, 1 year or more Correlation Summary
| Measurement | Immigrants from Yemen | Immigrants from North Macedonia |
| Minimum | 15.2% | 35.6% |
| Maximum | 59.5% | 78.3% |
| Range | 44.4% | 42.7% |
| Mean | 40.3% | 58.6% |
| Median | 44.2% | 59.8% |
| Interquartile 25% (IQ1) | 30.5% | 52.8% |
| Interquartile 75% (IQ3) | 49.5% | 63.0% |
| Interquartile Range (IQR) | 19.0% | 10.2% |
| Standard Deviation (Sample) | 12.7% | 8.7% |
| Standard Deviation (Population) | 12.6% | 8.6% |
Similar Demographics by College, 1 year or more
Demographics Similar to Immigrants from Yemen by College, 1 year or more
In terms of college, 1 year or more, the demographic groups most similar to Immigrants from Yemen are Native/Alaskan (50.2%, a difference of 0.35%), Cape Verdean (50.3%, a difference of 0.57%), Dutch West Indian (50.5%, a difference of 0.97%), Menominee (50.6%, a difference of 1.1%), and Dominican (50.6%, a difference of 1.1%).
| Demographics | Rating | Rank | College, 1 year or more |
| Immigrants | Cuba | 0.0 /100 | #324 | Tragic 50.7% |
| Immigrants | Latin America | 0.0 /100 | #325 | Tragic 50.7% |
| Dominicans | 0.0 /100 | #326 | Tragic 50.6% |
| Menominee | 0.0 /100 | #327 | Tragic 50.6% |
| Dutch West Indians | 0.0 /100 | #328 | Tragic 50.5% |
| Cape Verdeans | 0.0 /100 | #329 | Tragic 50.3% |
| Natives/Alaskans | 0.0 /100 | #330 | Tragic 50.2% |
| Immigrants | Yemen | 0.0 /100 | #331 | Tragic 50.0% |
| Mexicans | 0.0 /100 | #332 | Tragic 49.2% |
| Immigrants | Dominican Republic | 0.0 /100 | #333 | Tragic 49.1% |
| Lumbee | 0.0 /100 | #334 | Tragic 48.9% |
| Yuman | 0.0 /100 | #335 | Tragic 48.7% |
| Spanish American Indians | 0.0 /100 | #336 | Tragic 48.5% |
| Pennsylvania Germans | 0.0 /100 | #337 | Tragic 48.5% |
| Immigrants | Central America | 0.0 /100 | #338 | Tragic 48.5% |
Demographics Similar to Immigrants from North Macedonia by College, 1 year or more
In terms of college, 1 year or more, the demographic groups most similar to Immigrants from North Macedonia are Hungarian (59.5%, a difference of 0.010%), Immigrants from Southern Europe (59.5%, a difference of 0.020%), Welsh (59.5%, a difference of 0.040%), Immigrants from Albania (59.5%, a difference of 0.040%), and Immigrants from Sierra Leone (59.5%, a difference of 0.050%).
| Demographics | Rating | Rank | College, 1 year or more |
| South American Indians | 66.9 /100 | #160 | Good 60.0% |
| Somalis | 64.5 /100 | #161 | Good 59.9% |
| Koreans | 58.5 /100 | #162 | Average 59.7% |
| Immigrants | Somalia | 58.3 /100 | #163 | Average 59.7% |
| Belgians | 58.1 /100 | #164 | Average 59.7% |
| Irish | 56.1 /100 | #165 | Average 59.6% |
| Immigrants | Africa | 56.1 /100 | #166 | Average 59.6% |
| Immigrants | North Macedonia | 53.1 /100 | #167 | Average 59.5% |
| Hungarians | 52.9 /100 | #168 | Average 59.5% |
| Immigrants | Southern Europe | 52.7 /100 | #169 | Average 59.5% |
| Welsh | 52.4 /100 | #170 | Average 59.5% |
| Immigrants | Albania | 52.3 /100 | #171 | Average 59.5% |
| Immigrants | Sierra Leone | 52.2 /100 | #172 | Average 59.5% |
| Immigrants | Oceania | 51.2 /100 | #173 | Average 59.4% |
| Celtics | 50.0 /100 | #174 | Average 59.4% |