Immigrants from China vs Scandinavian Master's Degree
COMPARE
Immigrants from China
Scandinavian
Master's Degree
Master's Degree Comparison
Immigrants from China
Scandinavians
21.2%
MASTER'S DEGREE
100.0/ 100
METRIC RATING
11th/ 347
METRIC RANK
14.4%
MASTER'S DEGREE
23.3/ 100
METRIC RATING
206th/ 347
METRIC RANK
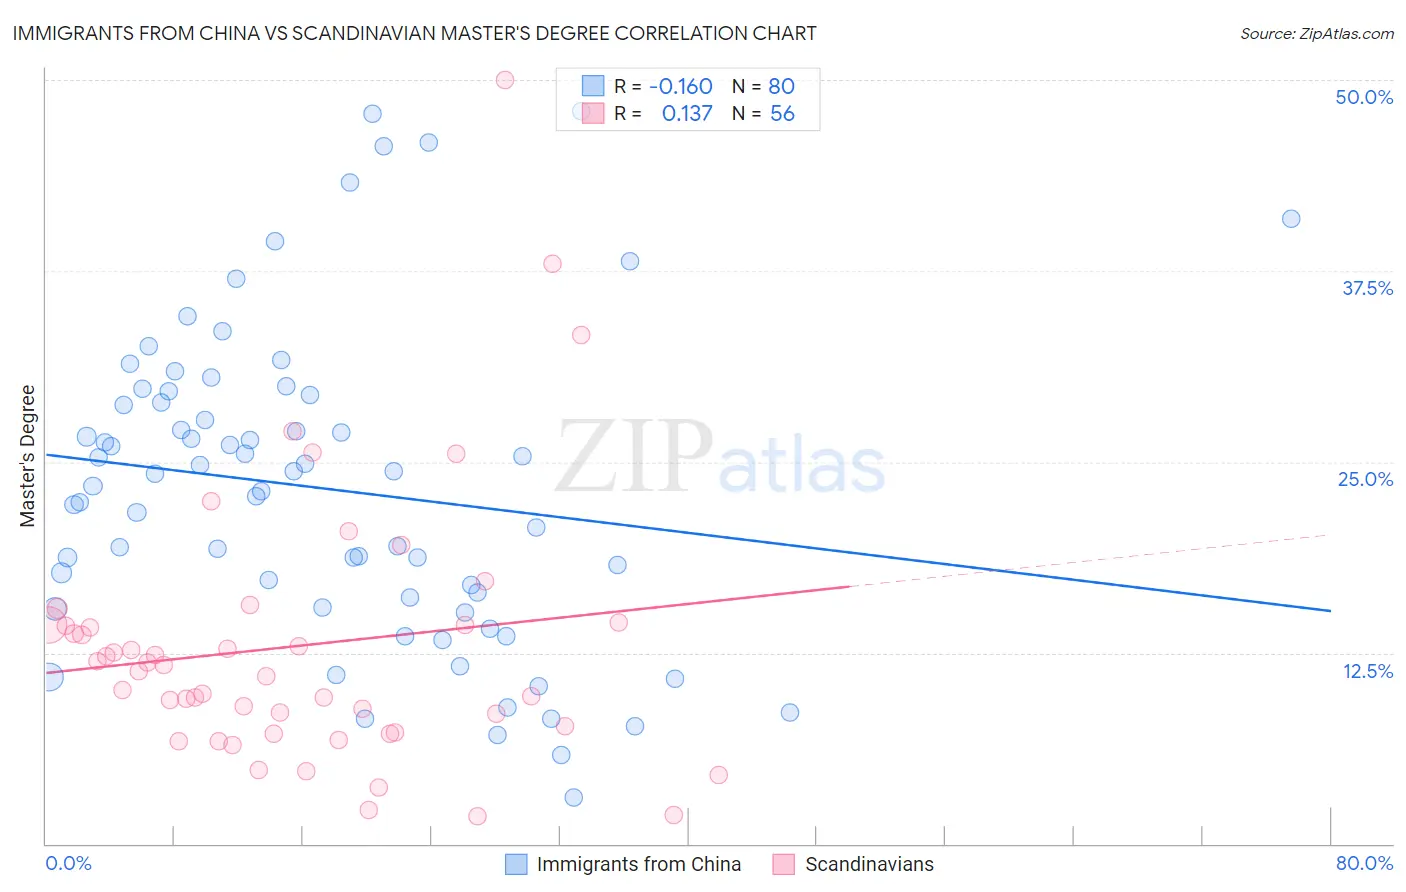
Immigrants from China vs Scandinavian Master's Degree Correlation Chart
The statistical analysis conducted on geographies consisting of 456,812,214 people shows a poor negative correlation between the proportion of Immigrants from China and percentage of population with at least master's degree education in the United States with a correlation coefficient (R) of -0.160 and weighted average of 21.2%. Similarly, the statistical analysis conducted on geographies consisting of 472,399,966 people shows a poor positive correlation between the proportion of Scandinavians and percentage of population with at least master's degree education in the United States with a correlation coefficient (R) of 0.137 and weighted average of 14.4%, a difference of 47.6%.
Master's Degree Correlation Summary
| Measurement | Immigrants from China | Scandinavian |
| Minimum | 3.0% | 1.8% |
| Maximum | 48.0% | 50.0% |
| Range | 44.9% | 48.2% |
| Mean | 23.2% | 12.9% |
| Median | 23.8% | 11.5% |
| Interquartile 25% (IQ1) | 15.8% | 7.5% |
| Interquartile 75% (IQ3) | 29.1% | 14.3% |
| Interquartile Range (IQR) | 13.3% | 6.8% |
| Standard Deviation (Sample) | 10.3% | 8.8% |
| Standard Deviation (Population) | 10.2% | 8.7% |
Similar Demographics by Master's Degree
Demographics Similar to Immigrants from China by Master's Degree
In terms of master's degree, the demographic groups most similar to Immigrants from China are Eastern European (21.1%, a difference of 0.32%), Immigrants from Australia (20.9%, a difference of 1.5%), Immigrants from Switzerland (20.9%, a difference of 1.5%), Immigrants from Eastern Asia (20.8%, a difference of 1.7%), and Immigrants from Belgium (20.8%, a difference of 2.0%).
| Demographics | Rating | Rank | Master's Degree |
| Okinawans | 100.0 /100 | #4 | Exceptional 22.6% |
| Immigrants | Taiwan | 100.0 /100 | #5 | Exceptional 22.5% |
| Immigrants | India | 100.0 /100 | #6 | Exceptional 22.3% |
| Iranians | 100.0 /100 | #7 | Exceptional 22.3% |
| Cypriots | 100.0 /100 | #8 | Exceptional 21.8% |
| Thais | 100.0 /100 | #9 | Exceptional 21.7% |
| Immigrants | Iran | 100.0 /100 | #10 | Exceptional 21.6% |
| Immigrants | China | 100.0 /100 | #11 | Exceptional 21.2% |
| Eastern Europeans | 100.0 /100 | #12 | Exceptional 21.1% |
| Immigrants | Australia | 100.0 /100 | #13 | Exceptional 20.9% |
| Immigrants | Switzerland | 100.0 /100 | #14 | Exceptional 20.9% |
| Immigrants | Eastern Asia | 100.0 /100 | #15 | Exceptional 20.8% |
| Immigrants | Belgium | 100.0 /100 | #16 | Exceptional 20.8% |
| Immigrants | South Central Asia | 100.0 /100 | #17 | Exceptional 20.7% |
| Soviet Union | 100.0 /100 | #18 | Exceptional 20.5% |
Demographics Similar to Scandinavians by Master's Degree
In terms of master's degree, the demographic groups most similar to Scandinavians are Trinidadian and Tobagonian (14.4%, a difference of 0.040%), French (14.4%, a difference of 0.070%), Yugoslavian (14.4%, a difference of 0.18%), Immigrants from Bosnia and Herzegovina (14.3%, a difference of 0.25%), and Immigrants from Western Africa (14.4%, a difference of 0.30%).
| Demographics | Rating | Rank | Master's Degree |
| Immigrants | Armenia | 27.2 /100 | #199 | Fair 14.5% |
| Panamanians | 25.1 /100 | #200 | Fair 14.4% |
| Scotch-Irish | 25.0 /100 | #201 | Fair 14.4% |
| Immigrants | Western Africa | 24.9 /100 | #202 | Fair 14.4% |
| Yugoslavians | 24.3 /100 | #203 | Fair 14.4% |
| French | 23.7 /100 | #204 | Fair 14.4% |
| Trinidadians and Tobagonians | 23.5 /100 | #205 | Fair 14.4% |
| Scandinavians | 23.3 /100 | #206 | Fair 14.4% |
| Immigrants | Bosnia and Herzegovina | 22.0 /100 | #207 | Fair 14.3% |
| Immigrants | Barbados | 20.5 /100 | #208 | Fair 14.3% |
| Immigrants | Panama | 20.0 /100 | #209 | Fair 14.3% |
| Sub-Saharan Africans | 19.4 /100 | #210 | Poor 14.2% |
| Somalis | 18.0 /100 | #211 | Poor 14.2% |
| Spanish | 17.8 /100 | #212 | Poor 14.2% |
| Immigrants | Thailand | 17.0 /100 | #213 | Poor 14.2% |