Icelander vs Scandinavian Master's Degree
COMPARE
Icelander
Scandinavian
Master's Degree
Master's Degree Comparison
Icelanders
Scandinavians
15.5%
MASTER'S DEGREE
76.8/ 100
METRIC RATING
153rd/ 347
METRIC RANK
14.4%
MASTER'S DEGREE
23.3/ 100
METRIC RATING
206th/ 347
METRIC RANK
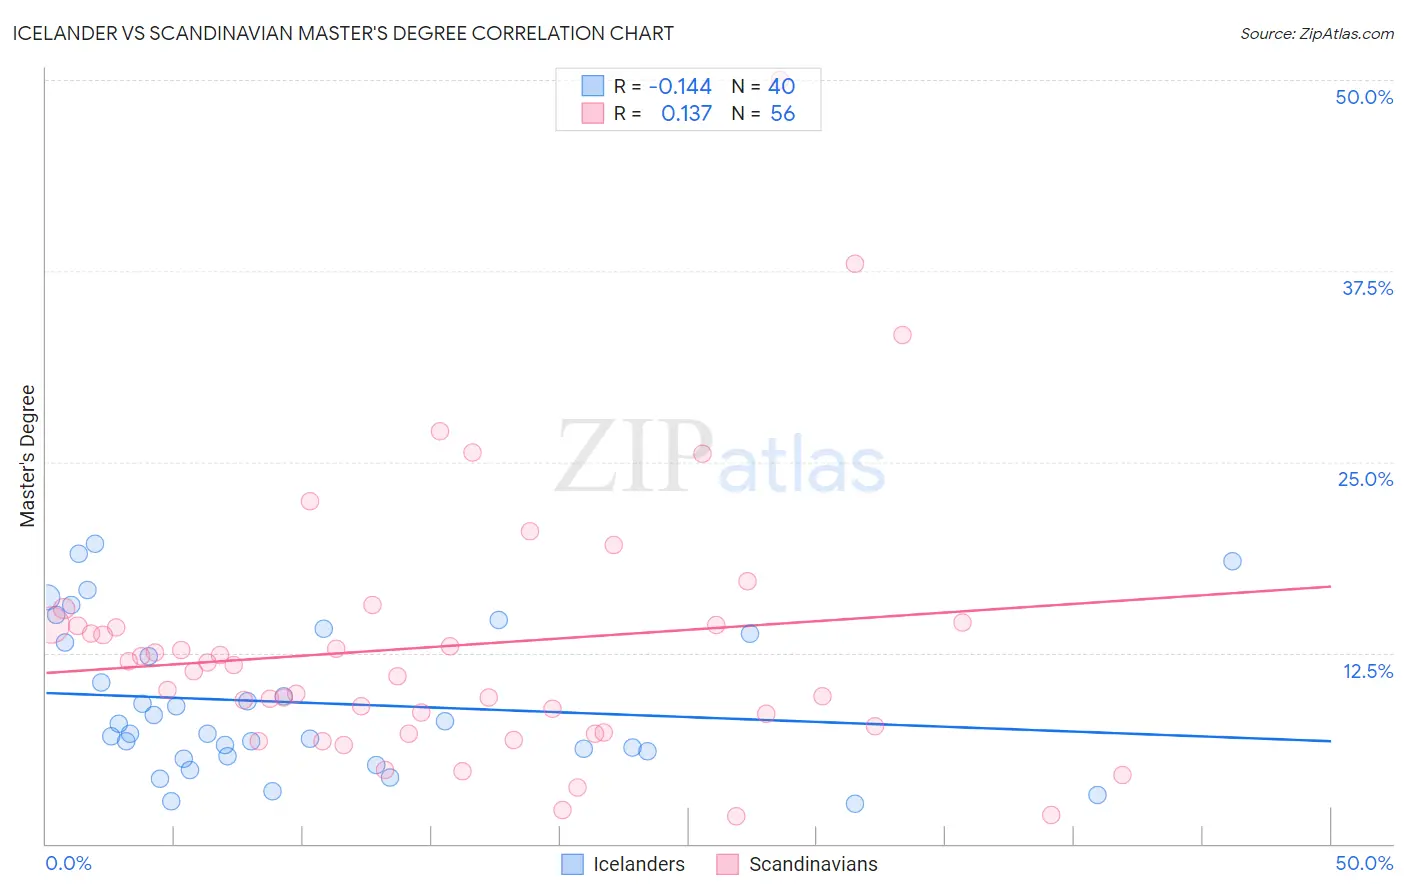
Icelander vs Scandinavian Master's Degree Correlation Chart
The statistical analysis conducted on geographies consisting of 159,641,316 people shows a poor negative correlation between the proportion of Icelanders and percentage of population with at least master's degree education in the United States with a correlation coefficient (R) of -0.144 and weighted average of 15.5%. Similarly, the statistical analysis conducted on geographies consisting of 472,399,966 people shows a poor positive correlation between the proportion of Scandinavians and percentage of population with at least master's degree education in the United States with a correlation coefficient (R) of 0.137 and weighted average of 14.4%, a difference of 8.0%.
Master's Degree Correlation Summary
| Measurement | Icelander | Scandinavian |
| Minimum | 2.6% | 1.8% |
| Maximum | 19.6% | 50.0% |
| Range | 17.0% | 48.2% |
| Mean | 9.2% | 12.9% |
| Median | 7.6% | 11.5% |
| Interquartile 25% (IQ1) | 5.9% | 7.5% |
| Interquartile 75% (IQ3) | 13.5% | 14.3% |
| Interquartile Range (IQR) | 7.6% | 6.8% |
| Standard Deviation (Sample) | 4.8% | 8.8% |
| Standard Deviation (Population) | 4.7% | 8.7% |
Similar Demographics by Master's Degree
Demographics Similar to Icelanders by Master's Degree
In terms of master's degree, the demographic groups most similar to Icelanders are Slavic (15.5%, a difference of 0.030%), Iraqi (15.5%, a difference of 0.080%), Immigrants from South America (15.5%, a difference of 0.090%), Immigrants from Bangladesh (15.5%, a difference of 0.13%), and Slovene (15.5%, a difference of 0.20%).
| Demographics | Rating | Rank | Master's Degree |
| Immigrants | Afghanistan | 79.4 /100 | #146 | Good 15.6% |
| Hungarians | 79.1 /100 | #147 | Good 15.6% |
| Immigrants | Senegal | 78.2 /100 | #148 | Good 15.5% |
| Ghanaians | 78.2 /100 | #149 | Good 15.5% |
| Slovenes | 78.0 /100 | #150 | Good 15.5% |
| Iraqis | 77.3 /100 | #151 | Good 15.5% |
| Slavs | 77.0 /100 | #152 | Good 15.5% |
| Icelanders | 76.8 /100 | #153 | Good 15.5% |
| Immigrants | South America | 76.3 /100 | #154 | Good 15.5% |
| Immigrants | Bangladesh | 76.1 /100 | #155 | Good 15.5% |
| Bermudans | 73.9 /100 | #156 | Good 15.4% |
| Immigrants | Cameroon | 71.7 /100 | #157 | Good 15.4% |
| Immigrants | Poland | 71.5 /100 | #158 | Good 15.4% |
| Luxembourgers | 71.0 /100 | #159 | Good 15.3% |
| Kenyans | 70.3 /100 | #160 | Good 15.3% |
Demographics Similar to Scandinavians by Master's Degree
In terms of master's degree, the demographic groups most similar to Scandinavians are Trinidadian and Tobagonian (14.4%, a difference of 0.040%), French (14.4%, a difference of 0.070%), Yugoslavian (14.4%, a difference of 0.18%), Immigrants from Bosnia and Herzegovina (14.3%, a difference of 0.25%), and Immigrants from Western Africa (14.4%, a difference of 0.30%).
| Demographics | Rating | Rank | Master's Degree |
| Immigrants | Armenia | 27.2 /100 | #199 | Fair 14.5% |
| Panamanians | 25.1 /100 | #200 | Fair 14.4% |
| Scotch-Irish | 25.0 /100 | #201 | Fair 14.4% |
| Immigrants | Western Africa | 24.9 /100 | #202 | Fair 14.4% |
| Yugoslavians | 24.3 /100 | #203 | Fair 14.4% |
| French | 23.7 /100 | #204 | Fair 14.4% |
| Trinidadians and Tobagonians | 23.5 /100 | #205 | Fair 14.4% |
| Scandinavians | 23.3 /100 | #206 | Fair 14.4% |
| Immigrants | Bosnia and Herzegovina | 22.0 /100 | #207 | Fair 14.3% |
| Immigrants | Barbados | 20.5 /100 | #208 | Fair 14.3% |
| Immigrants | Panama | 20.0 /100 | #209 | Fair 14.3% |
| Sub-Saharan Africans | 19.4 /100 | #210 | Poor 14.2% |
| Somalis | 18.0 /100 | #211 | Poor 14.2% |
| Spanish | 17.8 /100 | #212 | Poor 14.2% |
| Immigrants | Thailand | 17.0 /100 | #213 | Poor 14.2% |