Immigrants from China vs Scandinavian 3rd Grade
COMPARE
Immigrants from China
Scandinavian
3rd Grade
3rd Grade Comparison
Immigrants from China
Scandinavians
97.2%
3RD GRADE
0.2/ 100
METRIC RATING
270th/ 347
METRIC RANK
98.4%
3RD GRADE
100.0/ 100
METRIC RATING
32nd/ 347
METRIC RANK
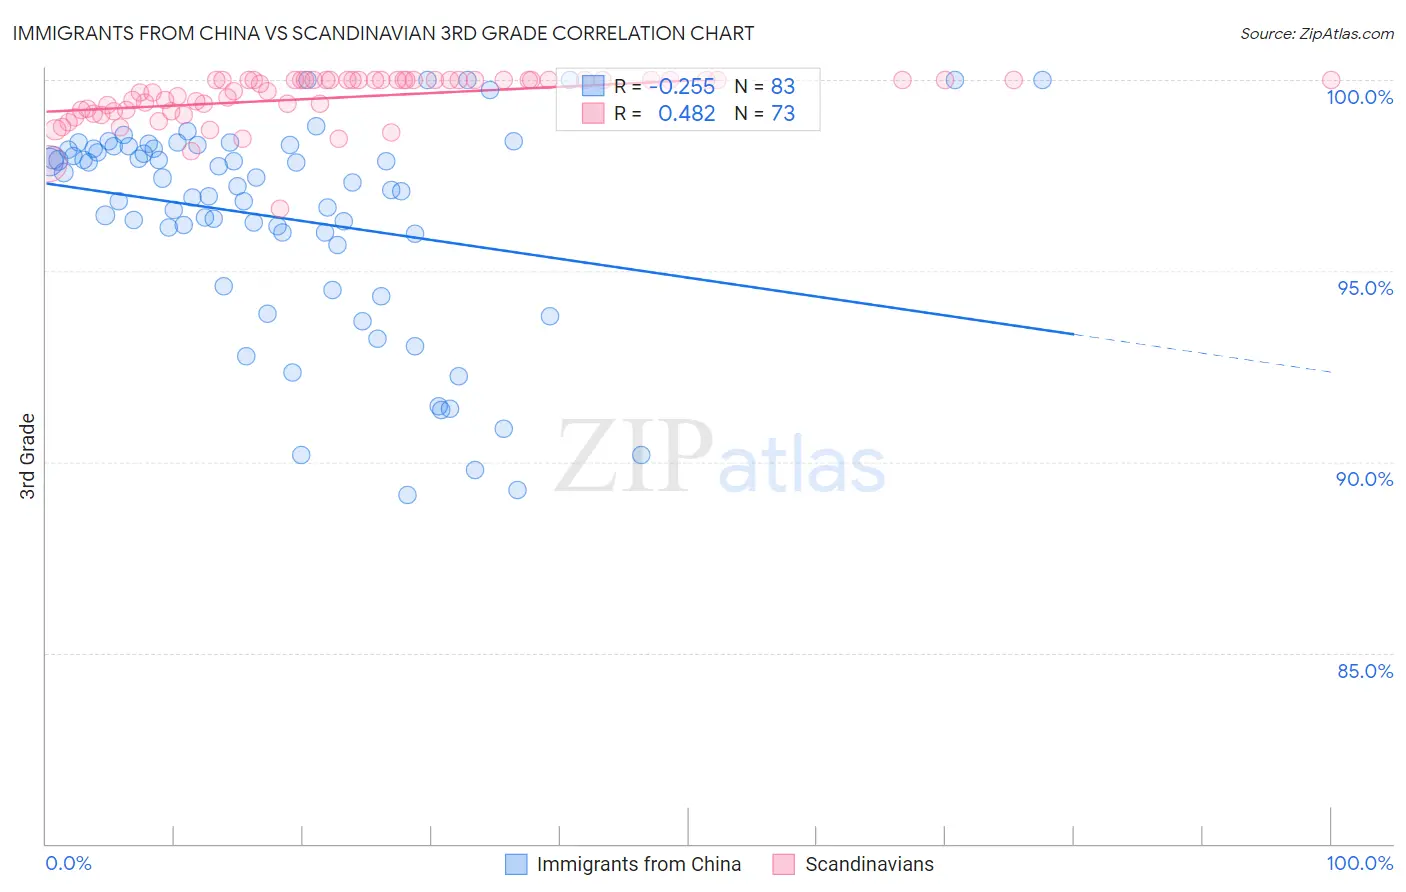
Immigrants from China vs Scandinavian 3rd Grade Correlation Chart
The statistical analysis conducted on geographies consisting of 457,082,957 people shows a weak negative correlation between the proportion of Immigrants from China and percentage of population with at least 3rd grade education in the United States with a correlation coefficient (R) of -0.255 and weighted average of 97.2%. Similarly, the statistical analysis conducted on geographies consisting of 472,660,430 people shows a moderate positive correlation between the proportion of Scandinavians and percentage of population with at least 3rd grade education in the United States with a correlation coefficient (R) of 0.482 and weighted average of 98.4%, a difference of 1.2%.
3rd Grade Correlation Summary
| Measurement | Immigrants from China | Scandinavian |
| Minimum | 89.1% | 96.6% |
| Maximum | 100.0% | 100.0% |
| Range | 10.9% | 3.4% |
| Mean | 96.4% | 99.5% |
| Median | 97.2% | 100.0% |
| Interquartile 25% (IQ1) | 95.7% | 99.2% |
| Interquartile 75% (IQ3) | 98.2% | 100.0% |
| Interquartile Range (IQR) | 2.5% | 0.80% |
| Standard Deviation (Sample) | 2.8% | 0.64% |
| Standard Deviation (Population) | 2.7% | 0.64% |
Similar Demographics by 3rd Grade
Demographics Similar to Immigrants from China by 3rd Grade
In terms of 3rd grade, the demographic groups most similar to Immigrants from China are Puerto Rican (97.2%, a difference of 0.010%), Ghanaian (97.2%, a difference of 0.010%), Immigrants from Peru (97.2%, a difference of 0.010%), Immigrants from Cameroon (97.2%, a difference of 0.010%), and Cuban (97.3%, a difference of 0.030%).
| Demographics | Rating | Rank | 3rd Grade |
| Taiwanese | 0.3 /100 | #263 | Tragic 97.3% |
| West Indians | 0.3 /100 | #264 | Tragic 97.3% |
| Immigrants | Jamaica | 0.3 /100 | #265 | Tragic 97.3% |
| Yaqui | 0.3 /100 | #266 | Tragic 97.3% |
| Immigrants | Nigeria | 0.3 /100 | #267 | Tragic 97.3% |
| Cubans | 0.2 /100 | #268 | Tragic 97.3% |
| Fijians | 0.2 /100 | #269 | Tragic 97.3% |
| Immigrants | China | 0.2 /100 | #270 | Tragic 97.2% |
| Puerto Ricans | 0.2 /100 | #271 | Tragic 97.2% |
| Ghanaians | 0.1 /100 | #272 | Tragic 97.2% |
| Immigrants | Peru | 0.1 /100 | #273 | Tragic 97.2% |
| Immigrants | Cameroon | 0.1 /100 | #274 | Tragic 97.2% |
| Immigrants | Uzbekistan | 0.1 /100 | #275 | Tragic 97.2% |
| Immigrants | Bolivia | 0.1 /100 | #276 | Tragic 97.2% |
| Trinidadians and Tobagonians | 0.1 /100 | #277 | Tragic 97.2% |
Demographics Similar to Scandinavians by 3rd Grade
In terms of 3rd grade, the demographic groups most similar to Scandinavians are Czech (98.4%, a difference of 0.0%), French Canadian (98.4%, a difference of 0.010%), European (98.4%, a difference of 0.010%), French (98.4%, a difference of 0.020%), and Chinese (98.4%, a difference of 0.020%).
| Demographics | Rating | Rank | 3rd Grade |
| Scotch-Irish | 100.0 /100 | #25 | Exceptional 98.5% |
| Aleuts | 100.0 /100 | #26 | Exceptional 98.5% |
| Croatians | 100.0 /100 | #27 | Exceptional 98.5% |
| French | 100.0 /100 | #28 | Exceptional 98.4% |
| French Canadians | 100.0 /100 | #29 | Exceptional 98.4% |
| Europeans | 100.0 /100 | #30 | Exceptional 98.4% |
| Czechs | 100.0 /100 | #31 | Exceptional 98.4% |
| Scandinavians | 100.0 /100 | #32 | Exceptional 98.4% |
| Chinese | 100.0 /100 | #33 | Exceptional 98.4% |
| Swiss | 100.0 /100 | #34 | Exceptional 98.4% |
| Arapaho | 100.0 /100 | #35 | Exceptional 98.4% |
| British | 99.9 /100 | #36 | Exceptional 98.4% |
| Italians | 99.9 /100 | #37 | Exceptional 98.4% |
| Chippewa | 99.9 /100 | #38 | Exceptional 98.4% |
| Latvians | 99.9 /100 | #39 | Exceptional 98.4% |