Hmong vs Scandinavian Master's Degree
COMPARE
Hmong
Scandinavian
Master's Degree
Master's Degree Comparison
Hmong
Scandinavians
13.4%
MASTER'S DEGREE
4.0/ 100
METRIC RATING
238th/ 347
METRIC RANK
14.4%
MASTER'S DEGREE
23.3/ 100
METRIC RATING
206th/ 347
METRIC RANK
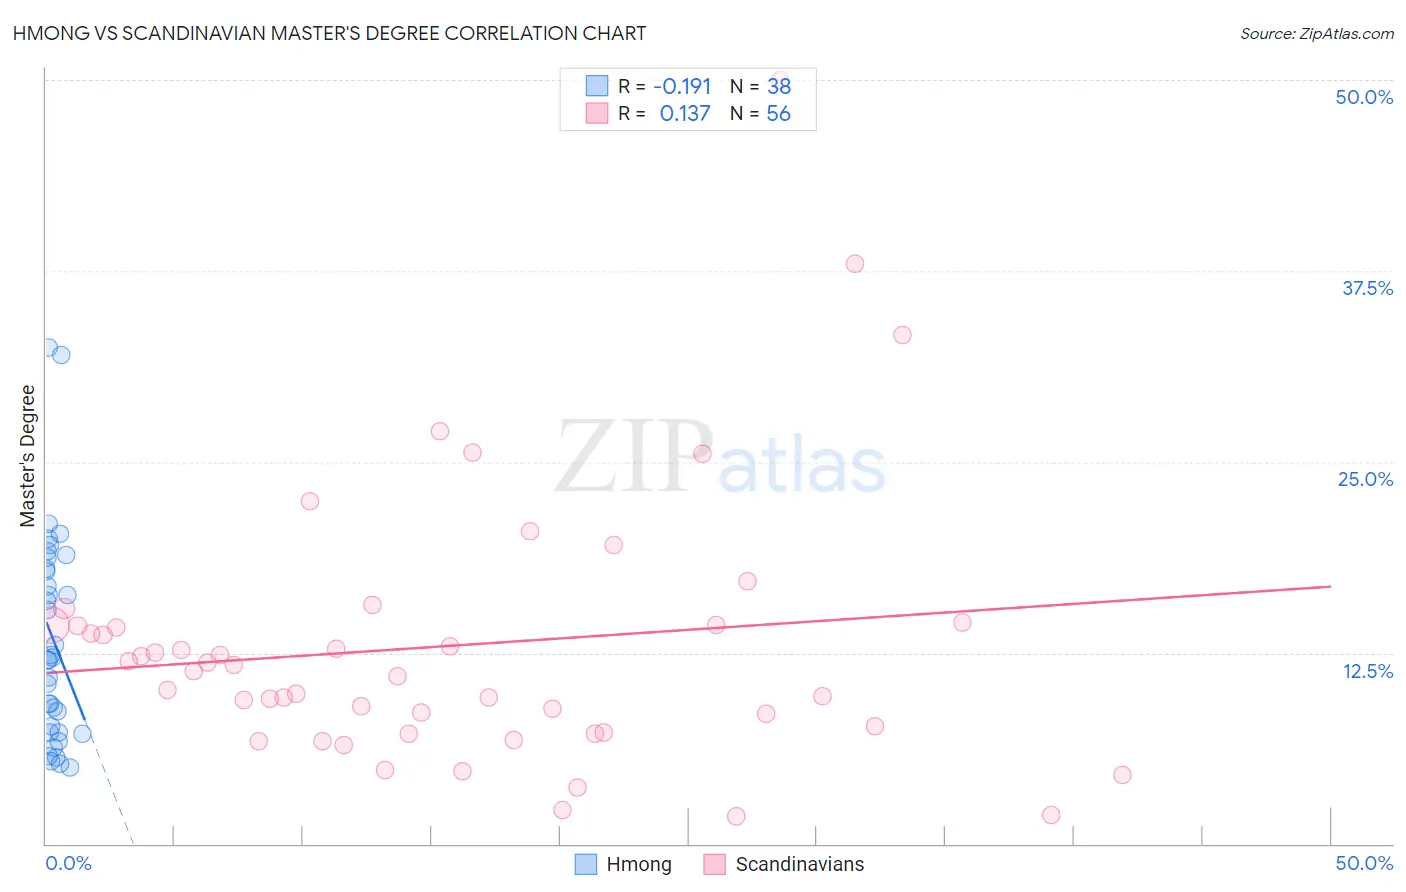
Hmong vs Scandinavian Master's Degree Correlation Chart
The statistical analysis conducted on geographies consisting of 24,664,732 people shows a poor negative correlation between the proportion of Hmong and percentage of population with at least master's degree education in the United States with a correlation coefficient (R) of -0.191 and weighted average of 13.4%. Similarly, the statistical analysis conducted on geographies consisting of 472,399,966 people shows a poor positive correlation between the proportion of Scandinavians and percentage of population with at least master's degree education in the United States with a correlation coefficient (R) of 0.137 and weighted average of 14.4%, a difference of 7.1%.
Master's Degree Correlation Summary
| Measurement | Hmong | Scandinavian |
| Minimum | 5.0% | 1.8% |
| Maximum | 32.5% | 50.0% |
| Range | 27.5% | 48.2% |
| Mean | 13.3% | 12.9% |
| Median | 12.1% | 11.5% |
| Interquartile 25% (IQ1) | 7.3% | 7.5% |
| Interquartile 75% (IQ3) | 18.0% | 14.3% |
| Interquartile Range (IQR) | 10.7% | 6.8% |
| Standard Deviation (Sample) | 6.8% | 8.8% |
| Standard Deviation (Population) | 6.7% | 8.7% |
Similar Demographics by Master's Degree
Demographics Similar to Hmong by Master's Degree
In terms of master's degree, the demographic groups most similar to Hmong are Jamaican (13.4%, a difference of 0.14%), Immigrants from Guyana (13.4%, a difference of 0.36%), German Russian (13.5%, a difference of 0.48%), Nonimmigrants (13.3%, a difference of 0.53%), and Immigrants from Burma/Myanmar (13.5%, a difference of 0.88%).
| Demographics | Rating | Rank | Master's Degree |
| Guyanese | 7.6 /100 | #231 | Tragic 13.7% |
| Immigrants | Philippines | 6.0 /100 | #232 | Tragic 13.6% |
| Immigrants | Ecuador | 5.7 /100 | #233 | Tragic 13.6% |
| Immigrants | Burma/Myanmar | 5.0 /100 | #234 | Tragic 13.5% |
| German Russians | 4.5 /100 | #235 | Tragic 13.5% |
| Immigrants | Guyana | 4.4 /100 | #236 | Tragic 13.4% |
| Jamaicans | 4.1 /100 | #237 | Tragic 13.4% |
| Hmong | 4.0 /100 | #238 | Tragic 13.4% |
| Immigrants | Nonimmigrants | 3.4 /100 | #239 | Tragic 13.3% |
| Guamanians/Chamorros | 2.2 /100 | #240 | Tragic 13.1% |
| U.S. Virgin Islanders | 2.1 /100 | #241 | Tragic 13.1% |
| Spanish Americans | 1.9 /100 | #242 | Tragic 13.0% |
| Immigrants | Jamaica | 1.9 /100 | #243 | Tragic 13.0% |
| Delaware | 1.7 /100 | #244 | Tragic 13.0% |
| Immigrants | Bahamas | 1.4 /100 | #245 | Tragic 12.9% |
Demographics Similar to Scandinavians by Master's Degree
In terms of master's degree, the demographic groups most similar to Scandinavians are Trinidadian and Tobagonian (14.4%, a difference of 0.040%), French (14.4%, a difference of 0.070%), Yugoslavian (14.4%, a difference of 0.18%), Immigrants from Bosnia and Herzegovina (14.3%, a difference of 0.25%), and Immigrants from Western Africa (14.4%, a difference of 0.30%).
| Demographics | Rating | Rank | Master's Degree |
| Immigrants | Armenia | 27.2 /100 | #199 | Fair 14.5% |
| Panamanians | 25.1 /100 | #200 | Fair 14.4% |
| Scotch-Irish | 25.0 /100 | #201 | Fair 14.4% |
| Immigrants | Western Africa | 24.9 /100 | #202 | Fair 14.4% |
| Yugoslavians | 24.3 /100 | #203 | Fair 14.4% |
| French | 23.7 /100 | #204 | Fair 14.4% |
| Trinidadians and Tobagonians | 23.5 /100 | #205 | Fair 14.4% |
| Scandinavians | 23.3 /100 | #206 | Fair 14.4% |
| Immigrants | Bosnia and Herzegovina | 22.0 /100 | #207 | Fair 14.3% |
| Immigrants | Barbados | 20.5 /100 | #208 | Fair 14.3% |
| Immigrants | Panama | 20.0 /100 | #209 | Fair 14.3% |
| Sub-Saharan Africans | 19.4 /100 | #210 | Poor 14.2% |
| Somalis | 18.0 /100 | #211 | Poor 14.2% |
| Spanish | 17.8 /100 | #212 | Poor 14.2% |
| Immigrants | Thailand | 17.0 /100 | #213 | Poor 14.2% |