Immigrants from China vs Haitian Master's Degree
COMPARE
Immigrants from China
Haitian
Master's Degree
Master's Degree Comparison
Immigrants from China
Haitians
21.2%
MASTER'S DEGREE
100.0/ 100
METRIC RATING
11th/ 347
METRIC RANK
12.1%
MASTER'S DEGREE
0.3/ 100
METRIC RATING
271st/ 347
METRIC RANK
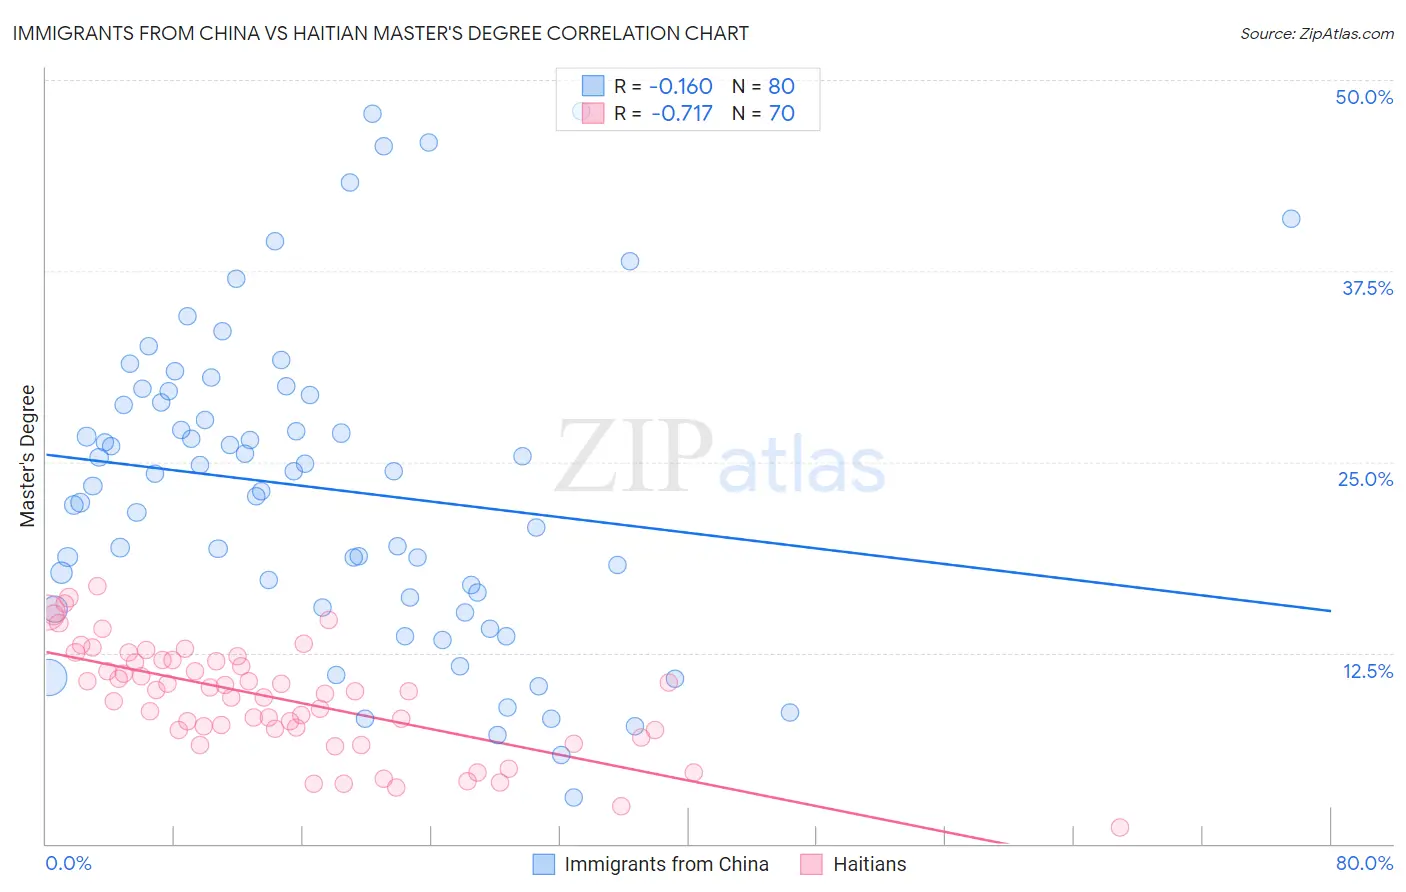
Immigrants from China vs Haitian Master's Degree Correlation Chart
The statistical analysis conducted on geographies consisting of 456,812,214 people shows a poor negative correlation between the proportion of Immigrants from China and percentage of population with at least master's degree education in the United States with a correlation coefficient (R) of -0.160 and weighted average of 21.2%. Similarly, the statistical analysis conducted on geographies consisting of 287,849,817 people shows a strong negative correlation between the proportion of Haitians and percentage of population with at least master's degree education in the United States with a correlation coefficient (R) of -0.717 and weighted average of 12.1%, a difference of 75.0%.
Master's Degree Correlation Summary
| Measurement | Immigrants from China | Haitian |
| Minimum | 3.0% | 1.1% |
| Maximum | 48.0% | 16.9% |
| Range | 44.9% | 15.8% |
| Mean | 23.2% | 9.5% |
| Median | 23.8% | 10.0% |
| Interquartile 25% (IQ1) | 15.8% | 7.5% |
| Interquartile 75% (IQ3) | 29.1% | 12.0% |
| Interquartile Range (IQR) | 13.3% | 4.6% |
| Standard Deviation (Sample) | 10.3% | 3.5% |
| Standard Deviation (Population) | 10.2% | 3.5% |
Similar Demographics by Master's Degree
Demographics Similar to Immigrants from China by Master's Degree
In terms of master's degree, the demographic groups most similar to Immigrants from China are Eastern European (21.1%, a difference of 0.32%), Immigrants from Australia (20.9%, a difference of 1.5%), Immigrants from Switzerland (20.9%, a difference of 1.5%), Immigrants from Eastern Asia (20.8%, a difference of 1.7%), and Immigrants from Belgium (20.8%, a difference of 2.0%).
| Demographics | Rating | Rank | Master's Degree |
| Okinawans | 100.0 /100 | #4 | Exceptional 22.6% |
| Immigrants | Taiwan | 100.0 /100 | #5 | Exceptional 22.5% |
| Immigrants | India | 100.0 /100 | #6 | Exceptional 22.3% |
| Iranians | 100.0 /100 | #7 | Exceptional 22.3% |
| Cypriots | 100.0 /100 | #8 | Exceptional 21.8% |
| Thais | 100.0 /100 | #9 | Exceptional 21.7% |
| Immigrants | Iran | 100.0 /100 | #10 | Exceptional 21.6% |
| Immigrants | China | 100.0 /100 | #11 | Exceptional 21.2% |
| Eastern Europeans | 100.0 /100 | #12 | Exceptional 21.1% |
| Immigrants | Australia | 100.0 /100 | #13 | Exceptional 20.9% |
| Immigrants | Switzerland | 100.0 /100 | #14 | Exceptional 20.9% |
| Immigrants | Eastern Asia | 100.0 /100 | #15 | Exceptional 20.8% |
| Immigrants | Belgium | 100.0 /100 | #16 | Exceptional 20.8% |
| Immigrants | South Central Asia | 100.0 /100 | #17 | Exceptional 20.7% |
| Soviet Union | 100.0 /100 | #18 | Exceptional 20.5% |
Demographics Similar to Haitians by Master's Degree
In terms of master's degree, the demographic groups most similar to Haitians are Comanche (12.1%, a difference of 0.060%), Blackfeet (12.1%, a difference of 0.15%), Cape Verdean (12.1%, a difference of 0.24%), Cuban (12.1%, a difference of 0.25%), and Black/African American (12.1%, a difference of 0.31%).
| Demographics | Rating | Rank | Master's Degree |
| Belizeans | 0.5 /100 | #264 | Tragic 12.4% |
| Immigrants | Fiji | 0.5 /100 | #265 | Tragic 12.4% |
| Bahamians | 0.5 /100 | #266 | Tragic 12.4% |
| Americans | 0.4 /100 | #267 | Tragic 12.3% |
| Native Hawaiians | 0.4 /100 | #268 | Tragic 12.3% |
| Central Americans | 0.3 /100 | #269 | Tragic 12.2% |
| Salvadorans | 0.3 /100 | #270 | Tragic 12.2% |
| Haitians | 0.3 /100 | #271 | Tragic 12.1% |
| Comanche | 0.3 /100 | #272 | Tragic 12.1% |
| Blackfeet | 0.3 /100 | #273 | Tragic 12.1% |
| Cape Verdeans | 0.3 /100 | #274 | Tragic 12.1% |
| Cubans | 0.3 /100 | #275 | Tragic 12.1% |
| Blacks/African Americans | 0.3 /100 | #276 | Tragic 12.1% |
| Immigrants | Caribbean | 0.3 /100 | #277 | Tragic 12.1% |
| Potawatomi | 0.3 /100 | #278 | Tragic 12.1% |