Immigrants from China vs Immigrants from Cuba Master's Degree
COMPARE
Immigrants from China
Immigrants from Cuba
Master's Degree
Master's Degree Comparison
Immigrants from China
Immigrants from Cuba
21.2%
MASTER'S DEGREE
100.0/ 100
METRIC RATING
11th/ 347
METRIC RANK
10.9%
MASTER'S DEGREE
0.0/ 100
METRIC RATING
318th/ 347
METRIC RANK
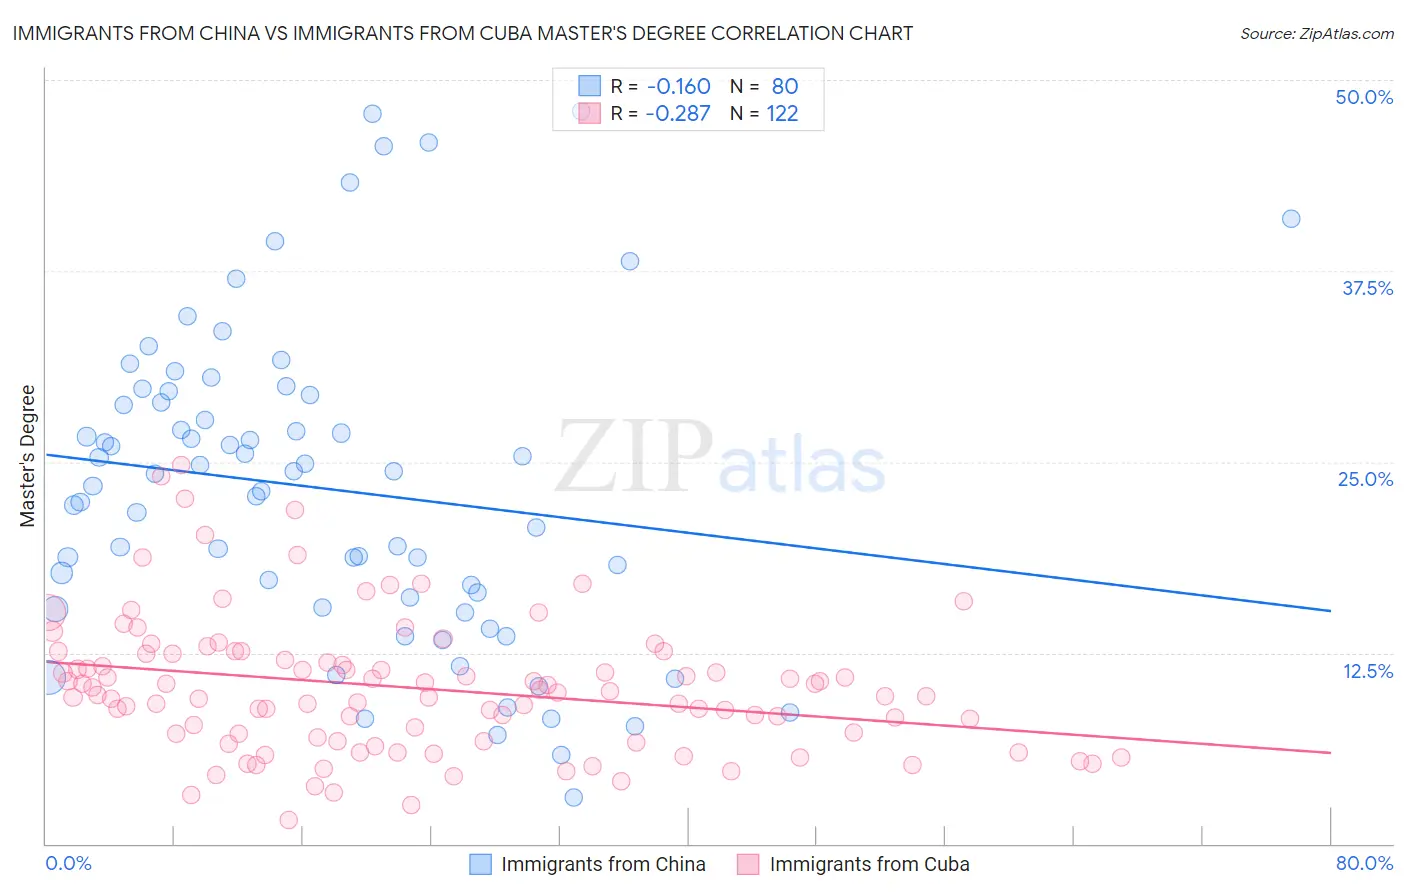
Immigrants from China vs Immigrants from Cuba Master's Degree Correlation Chart
The statistical analysis conducted on geographies consisting of 456,812,214 people shows a poor negative correlation between the proportion of Immigrants from China and percentage of population with at least master's degree education in the United States with a correlation coefficient (R) of -0.160 and weighted average of 21.2%. Similarly, the statistical analysis conducted on geographies consisting of 325,858,973 people shows a weak negative correlation between the proportion of Immigrants from Cuba and percentage of population with at least master's degree education in the United States with a correlation coefficient (R) of -0.287 and weighted average of 10.9%, a difference of 95.1%.
Master's Degree Correlation Summary
| Measurement | Immigrants from China | Immigrants from Cuba |
| Minimum | 3.0% | 1.5% |
| Maximum | 48.0% | 24.8% |
| Range | 44.9% | 23.3% |
| Mean | 23.2% | 10.2% |
| Median | 23.8% | 9.8% |
| Interquartile 25% (IQ1) | 15.8% | 6.9% |
| Interquartile 75% (IQ3) | 29.1% | 12.4% |
| Interquartile Range (IQR) | 13.3% | 5.5% |
| Standard Deviation (Sample) | 10.3% | 4.4% |
| Standard Deviation (Population) | 10.2% | 4.4% |
Similar Demographics by Master's Degree
Demographics Similar to Immigrants from China by Master's Degree
In terms of master's degree, the demographic groups most similar to Immigrants from China are Eastern European (21.1%, a difference of 0.32%), Immigrants from Australia (20.9%, a difference of 1.5%), Immigrants from Switzerland (20.9%, a difference of 1.5%), Immigrants from Eastern Asia (20.8%, a difference of 1.7%), and Immigrants from Belgium (20.8%, a difference of 2.0%).
| Demographics | Rating | Rank | Master's Degree |
| Okinawans | 100.0 /100 | #4 | Exceptional 22.6% |
| Immigrants | Taiwan | 100.0 /100 | #5 | Exceptional 22.5% |
| Immigrants | India | 100.0 /100 | #6 | Exceptional 22.3% |
| Iranians | 100.0 /100 | #7 | Exceptional 22.3% |
| Cypriots | 100.0 /100 | #8 | Exceptional 21.8% |
| Thais | 100.0 /100 | #9 | Exceptional 21.7% |
| Immigrants | Iran | 100.0 /100 | #10 | Exceptional 21.6% |
| Immigrants | China | 100.0 /100 | #11 | Exceptional 21.2% |
| Eastern Europeans | 100.0 /100 | #12 | Exceptional 21.1% |
| Immigrants | Australia | 100.0 /100 | #13 | Exceptional 20.9% |
| Immigrants | Switzerland | 100.0 /100 | #14 | Exceptional 20.9% |
| Immigrants | Eastern Asia | 100.0 /100 | #15 | Exceptional 20.8% |
| Immigrants | Belgium | 100.0 /100 | #16 | Exceptional 20.8% |
| Immigrants | South Central Asia | 100.0 /100 | #17 | Exceptional 20.7% |
| Soviet Union | 100.0 /100 | #18 | Exceptional 20.5% |
Demographics Similar to Immigrants from Cuba by Master's Degree
In terms of master's degree, the demographic groups most similar to Immigrants from Cuba are Hopi (10.9%, a difference of 0.13%), Kiowa (10.8%, a difference of 0.24%), Hispanic or Latino (10.9%, a difference of 0.67%), Immigrants from Micronesia (10.8%, a difference of 0.86%), and Cajun (11.0%, a difference of 1.0%).
| Demographics | Rating | Rank | Master's Degree |
| Seminole | 0.0 /100 | #311 | Tragic 11.0% |
| Choctaw | 0.0 /100 | #312 | Tragic 11.0% |
| Yaqui | 0.0 /100 | #313 | Tragic 11.0% |
| Cajuns | 0.0 /100 | #314 | Tragic 11.0% |
| Apache | 0.0 /100 | #315 | Tragic 11.0% |
| Hispanics or Latinos | 0.0 /100 | #316 | Tragic 10.9% |
| Hopi | 0.0 /100 | #317 | Tragic 10.9% |
| Immigrants | Cuba | 0.0 /100 | #318 | Tragic 10.9% |
| Kiowa | 0.0 /100 | #319 | Tragic 10.8% |
| Immigrants | Micronesia | 0.0 /100 | #320 | Tragic 10.8% |
| Pennsylvania Germans | 0.0 /100 | #321 | Tragic 10.7% |
| Sioux | 0.0 /100 | #322 | Tragic 10.7% |
| Crow | 0.0 /100 | #323 | Tragic 10.6% |
| Dutch West Indians | 0.0 /100 | #324 | Tragic 10.6% |
| Inupiat | 0.0 /100 | #325 | Tragic 10.5% |