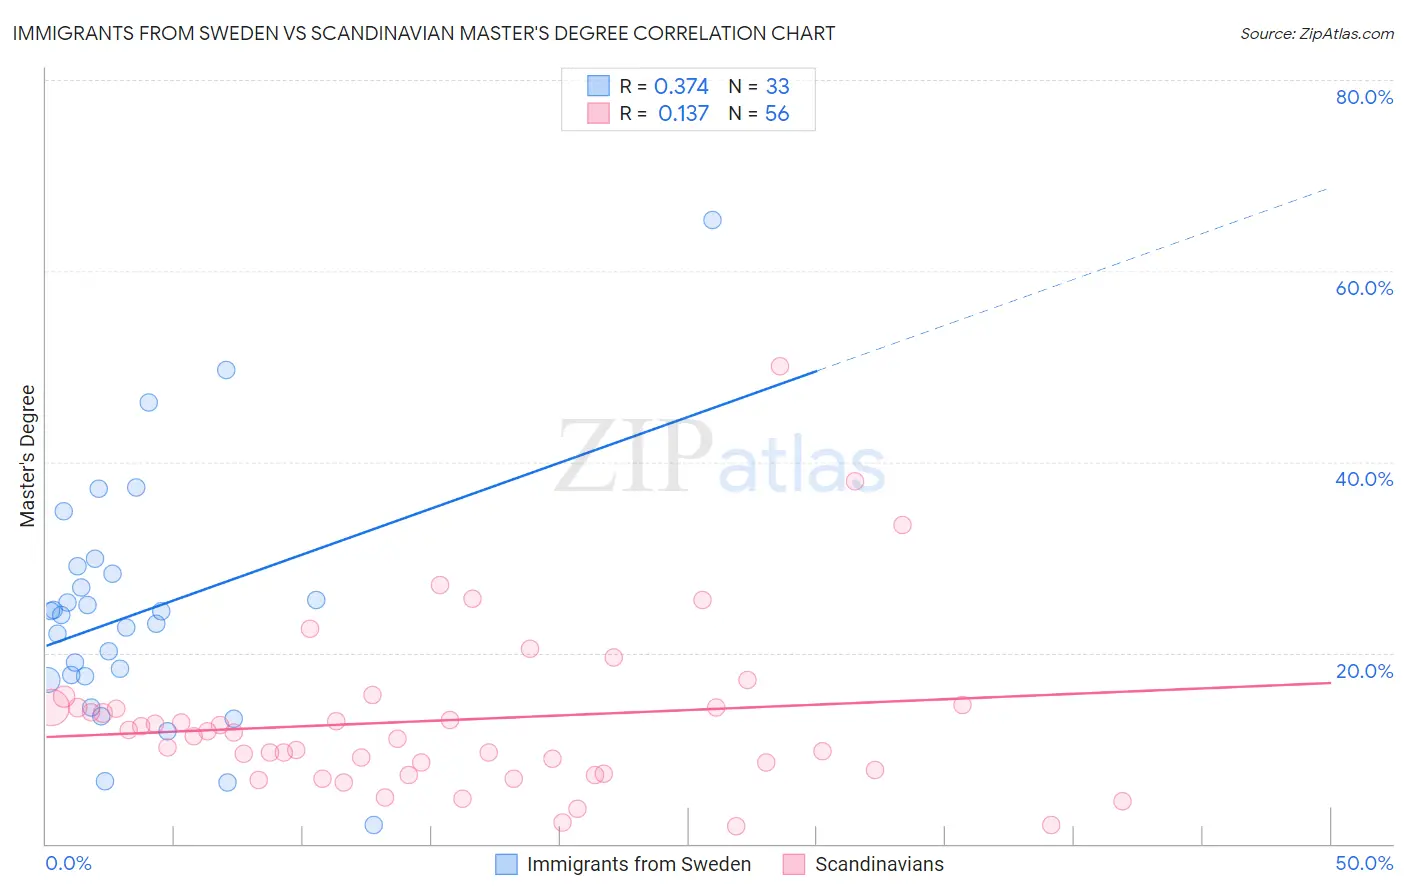
Immigrants from Sweden vs Scandinavian Master's Degree
COMPARE
Immigrants from Sweden
Scandinavian
Master's Degree
Master's Degree Comparison
Immigrants from Sweden
Scandinavians
20.3%
MASTER'S DEGREE
100.0/ 100
METRIC RATING
24th/ 347
METRIC RANK
14.4%
MASTER'S DEGREE
23.3/ 100
METRIC RATING
206th/ 347
METRIC RANK
Immigrants from Sweden vs Scandinavian Master's Degree Correlation Chart
The statistical analysis conducted on geographies consisting of 164,715,920 people shows a mild positive correlation between the proportion of Immigrants from Sweden and percentage of population with at least master's degree education in the United States with a correlation coefficient (R) of 0.374 and weighted average of 20.3%. Similarly, the statistical analysis conducted on geographies consisting of 472,399,966 people shows a poor positive correlation between the proportion of Scandinavians and percentage of population with at least master's degree education in the United States with a correlation coefficient (R) of 0.137 and weighted average of 14.4%, a difference of 41.2%.
Master's Degree Correlation Summary
| Measurement | Immigrants from Sweden | Scandinavian |
| Minimum | 2.0% | 1.8% |
| Maximum | 65.4% | 50.0% |
| Range | 63.4% | 48.2% |
| Mean | 24.3% | 12.9% |
| Median | 24.0% | 11.5% |
| Interquartile 25% (IQ1) | 17.3% | 7.5% |
| Interquartile 75% (IQ3) | 28.6% | 14.3% |
| Interquartile Range (IQR) | 11.3% | 6.8% |
| Standard Deviation (Sample) | 12.7% | 8.8% |
| Standard Deviation (Population) | 12.5% | 8.7% |
Similar Demographics by Master's Degree
Demographics Similar to Immigrants from Sweden by Master's Degree
In terms of master's degree, the demographic groups most similar to Immigrants from Sweden are Immigrants from France (20.3%, a difference of 0.070%), Israeli (20.3%, a difference of 0.35%), Immigrants from Ireland (20.4%, a difference of 0.77%), Indian (Asian) (20.5%, a difference of 0.88%), and Immigrants from Hong Kong (20.5%, a difference of 0.90%).
| Demographics | Rating | Rank | Master's Degree |
| Immigrants | South Central Asia | 100.0 /100 | #17 | Exceptional 20.7% |
| Soviet Union | 100.0 /100 | #18 | Exceptional 20.5% |
| Immigrants | Hong Kong | 100.0 /100 | #19 | Exceptional 20.5% |
| Indians (Asian) | 100.0 /100 | #20 | Exceptional 20.5% |
| Immigrants | Ireland | 100.0 /100 | #21 | Exceptional 20.4% |
| Israelis | 100.0 /100 | #22 | Exceptional 20.3% |
| Immigrants | France | 100.0 /100 | #23 | Exceptional 20.3% |
| Immigrants | Sweden | 100.0 /100 | #24 | Exceptional 20.3% |
| Immigrants | Japan | 100.0 /100 | #25 | Exceptional 20.0% |
| Cambodians | 100.0 /100 | #26 | Exceptional 20.0% |
| Immigrants | Sri Lanka | 100.0 /100 | #27 | Exceptional 19.9% |
| Turks | 100.0 /100 | #28 | Exceptional 19.9% |
| Latvians | 100.0 /100 | #29 | Exceptional 19.8% |
| Immigrants | Turkey | 100.0 /100 | #30 | Exceptional 19.7% |
| Immigrants | Korea | 100.0 /100 | #31 | Exceptional 19.7% |
Demographics Similar to Scandinavians by Master's Degree
In terms of master's degree, the demographic groups most similar to Scandinavians are Trinidadian and Tobagonian (14.4%, a difference of 0.040%), French (14.4%, a difference of 0.070%), Yugoslavian (14.4%, a difference of 0.18%), Immigrants from Bosnia and Herzegovina (14.3%, a difference of 0.25%), and Immigrants from Western Africa (14.4%, a difference of 0.30%).
| Demographics | Rating | Rank | Master's Degree |
| Immigrants | Armenia | 27.2 /100 | #199 | Fair 14.5% |
| Panamanians | 25.1 /100 | #200 | Fair 14.4% |
| Scotch-Irish | 25.0 /100 | #201 | Fair 14.4% |
| Immigrants | Western Africa | 24.9 /100 | #202 | Fair 14.4% |
| Yugoslavians | 24.3 /100 | #203 | Fair 14.4% |
| French | 23.7 /100 | #204 | Fair 14.4% |
| Trinidadians and Tobagonians | 23.5 /100 | #205 | Fair 14.4% |
| Scandinavians | 23.3 /100 | #206 | Fair 14.4% |
| Immigrants | Bosnia and Herzegovina | 22.0 /100 | #207 | Fair 14.3% |
| Immigrants | Barbados | 20.5 /100 | #208 | Fair 14.3% |
| Immigrants | Panama | 20.0 /100 | #209 | Fair 14.3% |
| Sub-Saharan Africans | 19.4 /100 | #210 | Poor 14.2% |
| Somalis | 18.0 /100 | #211 | Poor 14.2% |
| Spanish | 17.8 /100 | #212 | Poor 14.2% |
| Immigrants | Thailand | 17.0 /100 | #213 | Poor 14.2% |