Immigrants from Grenada vs Scandinavian Master's Degree
COMPARE
Immigrants from Grenada
Scandinavian
Master's Degree
Master's Degree Comparison
Immigrants from Grenada
Scandinavians
14.0%
MASTER'S DEGREE
11.8/ 100
METRIC RATING
224th/ 347
METRIC RANK
14.4%
MASTER'S DEGREE
23.3/ 100
METRIC RATING
206th/ 347
METRIC RANK
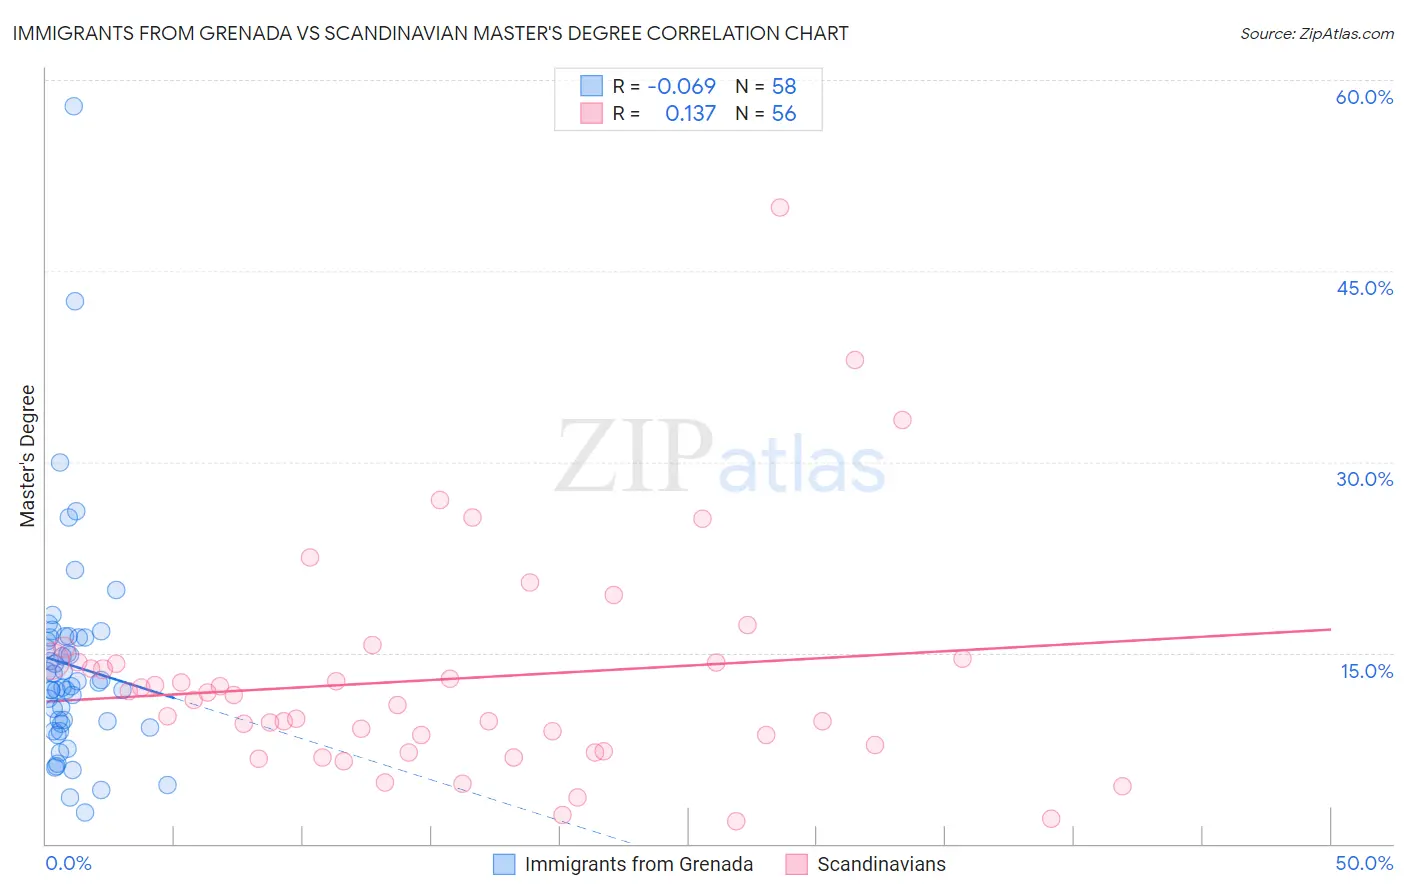
Immigrants from Grenada vs Scandinavian Master's Degree Correlation Chart
The statistical analysis conducted on geographies consisting of 67,201,096 people shows a slight negative correlation between the proportion of Immigrants from Grenada and percentage of population with at least master's degree education in the United States with a correlation coefficient (R) of -0.069 and weighted average of 14.0%. Similarly, the statistical analysis conducted on geographies consisting of 472,399,966 people shows a poor positive correlation between the proportion of Scandinavians and percentage of population with at least master's degree education in the United States with a correlation coefficient (R) of 0.137 and weighted average of 14.4%, a difference of 2.8%.
Master's Degree Correlation Summary
| Measurement | Immigrants from Grenada | Scandinavian |
| Minimum | 2.4% | 1.8% |
| Maximum | 57.9% | 50.0% |
| Range | 55.5% | 48.2% |
| Mean | 14.0% | 12.9% |
| Median | 12.5% | 11.5% |
| Interquartile 25% (IQ1) | 9.5% | 7.5% |
| Interquartile 75% (IQ3) | 16.2% | 14.3% |
| Interquartile Range (IQR) | 6.7% | 6.8% |
| Standard Deviation (Sample) | 8.9% | 8.8% |
| Standard Deviation (Population) | 8.8% | 8.7% |
Demographics Similar to Immigrants from Grenada and Scandinavians by Master's Degree
In terms of master's degree, the demographic groups most similar to Immigrants from Grenada are Immigrants from South Eastern Asia (14.0%, a difference of 0.050%), Portuguese (13.9%, a difference of 0.21%), Ecuadorian (14.0%, a difference of 0.25%), Korean (14.0%, a difference of 0.28%), and German (14.0%, a difference of 0.41%). Similarly, the demographic groups most similar to Scandinavians are Trinidadian and Tobagonian (14.4%, a difference of 0.040%), Immigrants from Bosnia and Herzegovina (14.3%, a difference of 0.25%), Immigrants from Barbados (14.3%, a difference of 0.55%), Immigrants from Panama (14.3%, a difference of 0.64%), and Subsaharan African (14.2%, a difference of 0.77%).
| Demographics | Rating | Rank | Master's Degree |
| Trinidadians and Tobagonians | 23.5 /100 | #205 | Fair 14.4% |
| Scandinavians | 23.3 /100 | #206 | Fair 14.4% |
| Immigrants | Bosnia and Herzegovina | 22.0 /100 | #207 | Fair 14.3% |
| Immigrants | Barbados | 20.5 /100 | #208 | Fair 14.3% |
| Immigrants | Panama | 20.0 /100 | #209 | Fair 14.3% |
| Sub-Saharan Africans | 19.4 /100 | #210 | Poor 14.2% |
| Somalis | 18.0 /100 | #211 | Poor 14.2% |
| Spanish | 17.8 /100 | #212 | Poor 14.2% |
| Immigrants | Thailand | 17.0 /100 | #213 | Poor 14.2% |
| Finns | 16.9 /100 | #214 | Poor 14.2% |
| Immigrants | Vietnam | 16.1 /100 | #215 | Poor 14.1% |
| Immigrants | Somalia | 15.8 /100 | #216 | Poor 14.1% |
| Immigrants | Trinidad and Tobago | 15.8 /100 | #217 | Poor 14.1% |
| French Canadians | 14.9 /100 | #218 | Poor 14.1% |
| Norwegians | 13.6 /100 | #219 | Poor 14.0% |
| Germans | 13.1 /100 | #220 | Poor 14.0% |
| Koreans | 12.7 /100 | #221 | Poor 14.0% |
| Ecuadorians | 12.6 /100 | #222 | Poor 14.0% |
| Immigrants | South Eastern Asia | 11.9 /100 | #223 | Poor 14.0% |
| Immigrants | Grenada | 11.8 /100 | #224 | Poor 14.0% |
| Portuguese | 11.2 /100 | #225 | Poor 13.9% |