Immigrants from Burma/Myanmar vs Nepalese GED/Equivalency
COMPARE
Immigrants from Burma/Myanmar
Nepalese
GED/Equivalency
GED/Equivalency Comparison
Immigrants from Burma/Myanmar
Nepalese
83.0%
GED/EQUIVALENCY
0.2/ 100
METRIC RATING
268th/ 347
METRIC RANK
81.9%
GED/EQUIVALENCY
0.0/ 100
METRIC RATING
295th/ 347
METRIC RANK
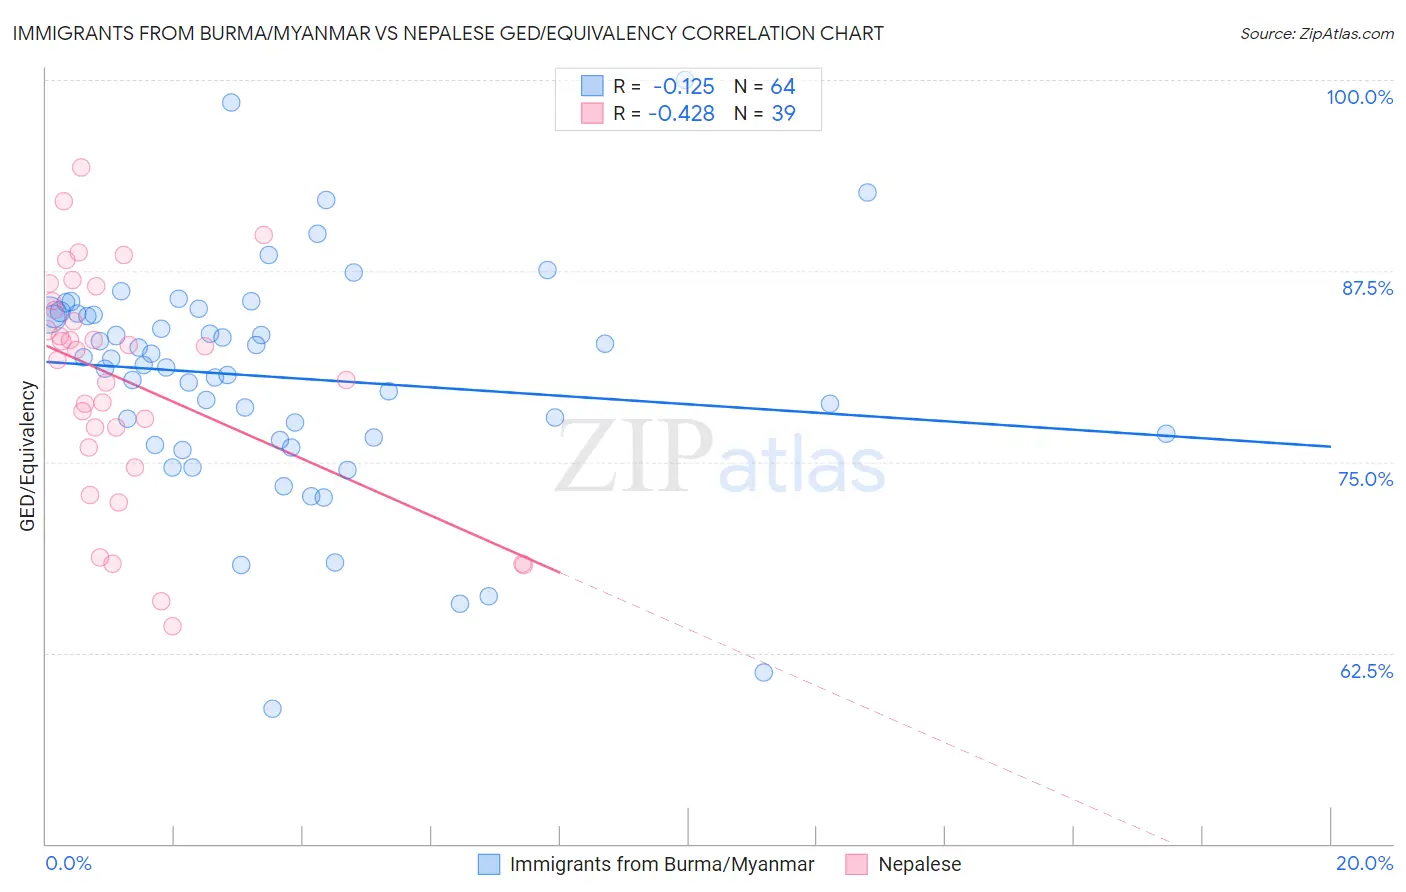
Immigrants from Burma/Myanmar vs Nepalese GED/Equivalency Correlation Chart
The statistical analysis conducted on geographies consisting of 172,357,706 people shows a poor negative correlation between the proportion of Immigrants from Burma/Myanmar and percentage of population with at least ged/equivalency education in the United States with a correlation coefficient (R) of -0.125 and weighted average of 83.0%. Similarly, the statistical analysis conducted on geographies consisting of 24,519,269 people shows a moderate negative correlation between the proportion of Nepalese and percentage of population with at least ged/equivalency education in the United States with a correlation coefficient (R) of -0.428 and weighted average of 81.9%, a difference of 1.3%.
GED/Equivalency Correlation Summary
| Measurement | Immigrants from Burma/Myanmar | Nepalese |
| Minimum | 58.8% | 64.2% |
| Maximum | 100.0% | 94.3% |
| Range | 41.2% | 30.1% |
| Mean | 80.5% | 80.3% |
| Median | 81.5% | 82.3% |
| Interquartile 25% (IQ1) | 76.5% | 75.9% |
| Interquartile 75% (IQ3) | 84.7% | 85.5% |
| Interquartile Range (IQR) | 8.1% | 9.6% |
| Standard Deviation (Sample) | 7.5% | 7.4% |
| Standard Deviation (Population) | 7.4% | 7.4% |
Similar Demographics by GED/Equivalency
Demographics Similar to Immigrants from Burma/Myanmar by GED/Equivalency
In terms of ged/equivalency, the demographic groups most similar to Immigrants from Burma/Myanmar are Trinidadian and Tobagonian (83.0%, a difference of 0.040%), Hopi (83.0%, a difference of 0.040%), West Indian (83.1%, a difference of 0.060%), Kiowa (83.1%, a difference of 0.060%), and Bangladeshi (83.1%, a difference of 0.070%).
| Demographics | Rating | Rank | GED/Equivalency |
| Inupiat | 0.2 /100 | #261 | Tragic 83.1% |
| Immigrants | Armenia | 0.2 /100 | #262 | Tragic 83.1% |
| Immigrants | Congo | 0.2 /100 | #263 | Tragic 83.1% |
| Bangladeshis | 0.2 /100 | #264 | Tragic 83.1% |
| West Indians | 0.2 /100 | #265 | Tragic 83.1% |
| Kiowa | 0.2 /100 | #266 | Tragic 83.1% |
| Trinidadians and Tobagonians | 0.2 /100 | #267 | Tragic 83.0% |
| Immigrants | Burma/Myanmar | 0.2 /100 | #268 | Tragic 83.0% |
| Hopi | 0.2 /100 | #269 | Tragic 83.0% |
| Immigrants | Jamaica | 0.2 /100 | #270 | Tragic 82.9% |
| U.S. Virgin Islanders | 0.2 /100 | #271 | Tragic 82.9% |
| Barbadians | 0.1 /100 | #272 | Tragic 82.9% |
| Pennsylvania Germans | 0.1 /100 | #273 | Tragic 82.9% |
| Immigrants | Trinidad and Tobago | 0.1 /100 | #274 | Tragic 82.8% |
| Seminole | 0.1 /100 | #275 | Tragic 82.8% |
Demographics Similar to Nepalese by GED/Equivalency
In terms of ged/equivalency, the demographic groups most similar to Nepalese are Vietnamese (81.9%, a difference of 0.030%), Immigrants from St. Vincent and the Grenadines (82.0%, a difference of 0.060%), Immigrants from Bangladesh (81.9%, a difference of 0.070%), British West Indian (82.0%, a difference of 0.080%), and Paiute (82.0%, a difference of 0.090%).
| Demographics | Rating | Rank | GED/Equivalency |
| Pueblo | 0.0 /100 | #288 | Tragic 82.3% |
| Immigrants | Cambodia | 0.0 /100 | #289 | Tragic 82.2% |
| Haitians | 0.0 /100 | #290 | Tragic 82.1% |
| Cubans | 0.0 /100 | #291 | Tragic 82.0% |
| Paiute | 0.0 /100 | #292 | Tragic 82.0% |
| British West Indians | 0.0 /100 | #293 | Tragic 82.0% |
| Immigrants | St. Vincent and the Grenadines | 0.0 /100 | #294 | Tragic 82.0% |
| Nepalese | 0.0 /100 | #295 | Tragic 81.9% |
| Vietnamese | 0.0 /100 | #296 | Tragic 81.9% |
| Immigrants | Bangladesh | 0.0 /100 | #297 | Tragic 81.9% |
| Ute | 0.0 /100 | #298 | Tragic 81.8% |
| Ecuadorians | 0.0 /100 | #299 | Tragic 81.7% |
| Fijians | 0.0 /100 | #300 | Tragic 81.6% |
| Dutch West Indians | 0.0 /100 | #301 | Tragic 81.6% |
| Immigrants | Haiti | 0.0 /100 | #302 | Tragic 81.6% |