Immigrants from Burma/Myanmar vs Nepalese Householder Income Over 65 years
COMPARE
Immigrants from Burma/Myanmar
Nepalese
Householder Income Over 65 years
Householder Income Over 65 years Comparison
Immigrants from Burma/Myanmar
Nepalese
$57,114
HOUSEHOLDER INCOME OVER 65 YEARS
1.7/ 100
METRIC RATING
234th/ 347
METRIC RANK
$58,761
HOUSEHOLDER INCOME OVER 65 YEARS
9.0/ 100
METRIC RATING
214th/ 347
METRIC RANK
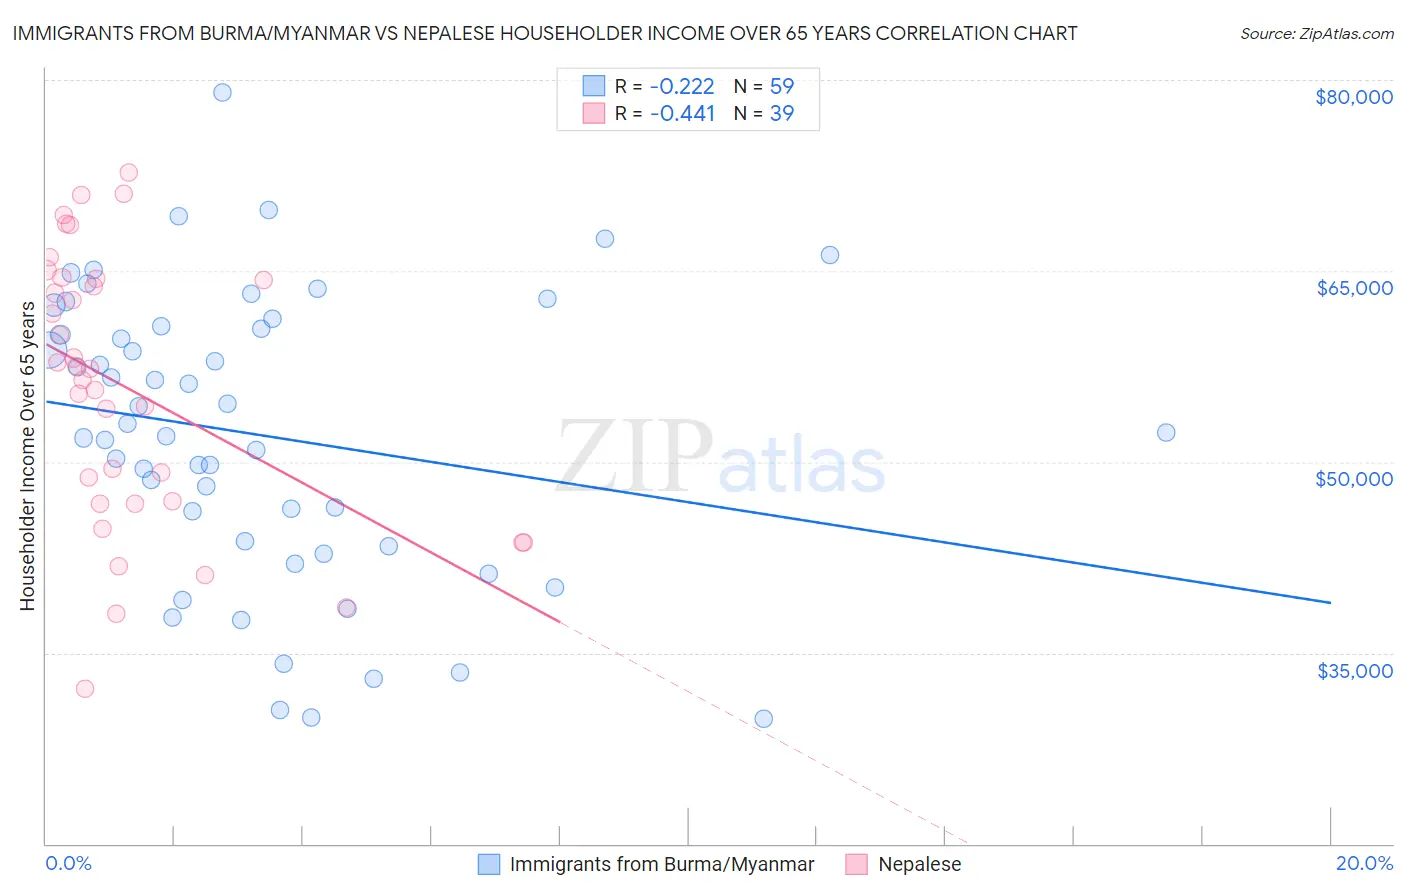
Immigrants from Burma/Myanmar vs Nepalese Householder Income Over 65 years Correlation Chart
The statistical analysis conducted on geographies consisting of 172,033,501 people shows a weak negative correlation between the proportion of Immigrants from Burma/Myanmar and household income with householder over the age of 65 in the United States with a correlation coefficient (R) of -0.222 and weighted average of $57,114. Similarly, the statistical analysis conducted on geographies consisting of 24,501,136 people shows a moderate negative correlation between the proportion of Nepalese and household income with householder over the age of 65 in the United States with a correlation coefficient (R) of -0.441 and weighted average of $58,761, a difference of 2.9%.
Householder Income Over 65 years Correlation Summary
| Measurement | Immigrants from Burma/Myanmar | Nepalese |
| Minimum | $29,861 | $32,174 |
| Maximum | $78,969 | $72,725 |
| Range | $49,108 | $40,551 |
| Mean | $52,112 | $55,785 |
| Median | $52,321 | $57,344 |
| Interquartile 25% (IQ1) | $43,364 | $46,756 |
| Interquartile 75% (IQ3) | $60,699 | $64,405 |
| Interquartile Range (IQR) | $17,335 | $17,649 |
| Standard Deviation (Sample) | $11,315 | $10,626 |
| Standard Deviation (Population) | $11,219 | $10,489 |
Demographics Similar to Immigrants from Burma/Myanmar and Nepalese by Householder Income Over 65 years
In terms of householder income over 65 years, the demographic groups most similar to Immigrants from Burma/Myanmar are Immigrants from Western Africa ($57,119, a difference of 0.010%), Immigrants from Venezuela ($57,371, a difference of 0.45%), Nonimmigrants ($57,426, a difference of 0.55%), Immigrants from Cambodia ($57,580, a difference of 0.82%), and Immigrants from Colombia ($57,658, a difference of 0.95%). Similarly, the demographic groups most similar to Nepalese are Immigrants from Ghana ($58,624, a difference of 0.23%), Immigrants from Middle Africa ($58,375, a difference of 0.66%), Sudanese ($58,281, a difference of 0.82%), Panamanian ($58,266, a difference of 0.85%), and Malaysian ($58,244, a difference of 0.89%).
| Demographics | Rating | Rank | Householder Income Over 65 years |
| Nepalese | 9.0 /100 | #214 | Tragic $58,761 |
| Immigrants | Ghana | 7.9 /100 | #215 | Tragic $58,624 |
| Immigrants | Middle Africa | 6.2 /100 | #216 | Tragic $58,375 |
| Sudanese | 5.7 /100 | #217 | Tragic $58,281 |
| Panamanians | 5.6 /100 | #218 | Tragic $58,266 |
| Malaysians | 5.5 /100 | #219 | Tragic $58,244 |
| Yugoslavians | 5.5 /100 | #220 | Tragic $58,243 |
| Immigrants | El Salvador | 5.4 /100 | #221 | Tragic $58,226 |
| Delaware | 5.3 /100 | #222 | Tragic $58,214 |
| Tsimshian | 5.2 /100 | #223 | Tragic $58,202 |
| Bermudans | 5.1 /100 | #224 | Tragic $58,171 |
| Venezuelans | 4.4 /100 | #225 | Tragic $58,026 |
| French Canadians | 4.2 /100 | #226 | Tragic $57,975 |
| Japanese | 3.9 /100 | #227 | Tragic $57,919 |
| Immigrants | Albania | 3.6 /100 | #228 | Tragic $57,828 |
| Immigrants | Colombia | 3.0 /100 | #229 | Tragic $57,658 |
| Immigrants | Cambodia | 2.8 /100 | #230 | Tragic $57,580 |
| Immigrants | Nonimmigrants | 2.4 /100 | #231 | Tragic $57,426 |
| Immigrants | Venezuela | 2.3 /100 | #232 | Tragic $57,371 |
| Immigrants | Western Africa | 1.7 /100 | #233 | Tragic $57,119 |
| Immigrants | Burma/Myanmar | 1.7 /100 | #234 | Tragic $57,114 |