Cape Verdean vs Nepalese GED/Equivalency
COMPARE
Cape Verdean
Nepalese
GED/Equivalency
GED/Equivalency Comparison
Cape Verdeans
Nepalese
80.9%
GED/EQUIVALENCY
0.0/ 100
METRIC RATING
313th/ 347
METRIC RANK
81.9%
GED/EQUIVALENCY
0.0/ 100
METRIC RATING
295th/ 347
METRIC RANK
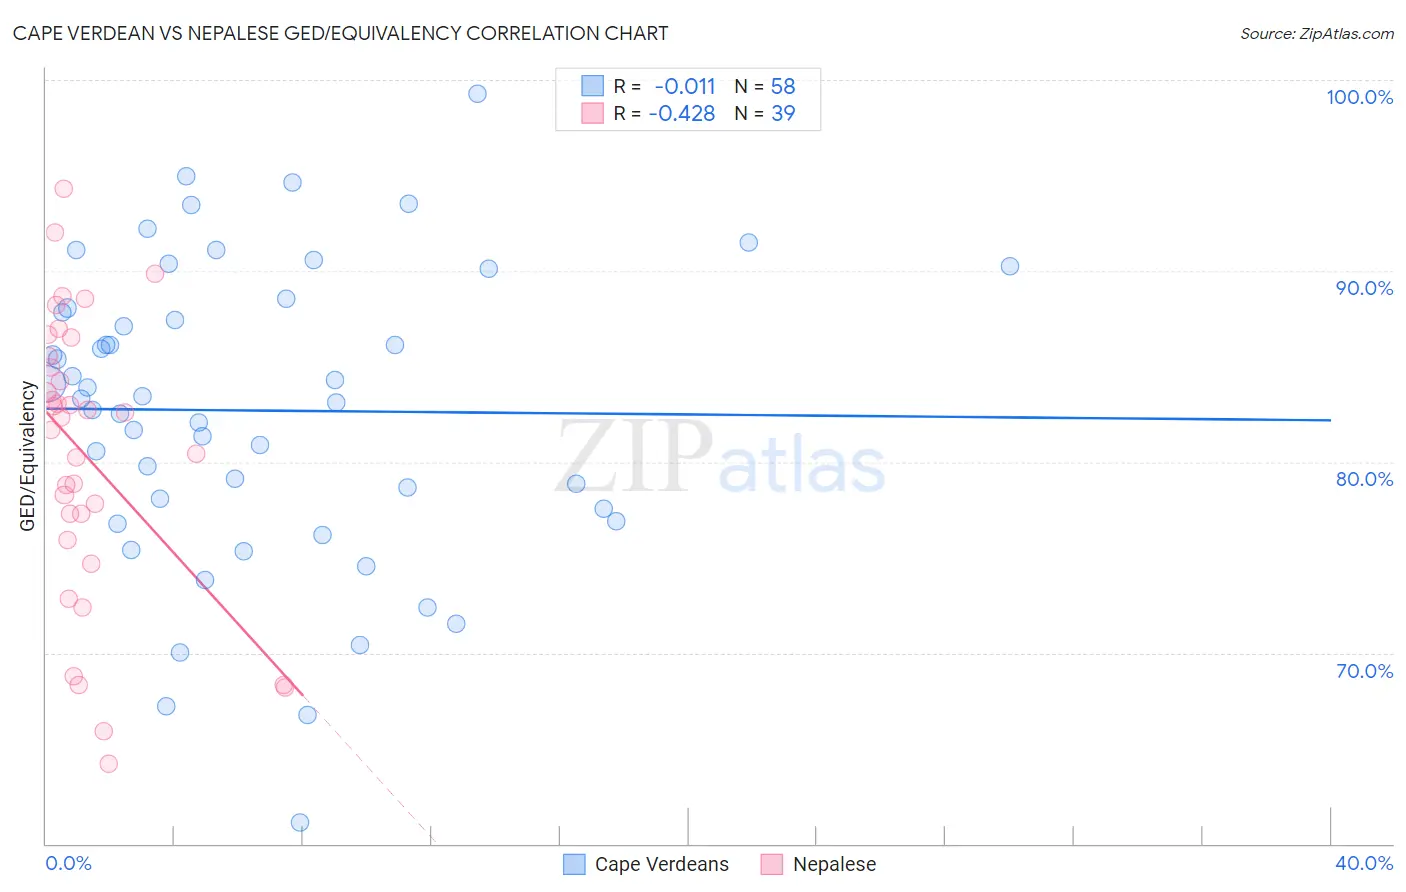
Cape Verdean vs Nepalese GED/Equivalency Correlation Chart
The statistical analysis conducted on geographies consisting of 107,537,955 people shows no correlation between the proportion of Cape Verdeans and percentage of population with at least ged/equivalency education in the United States with a correlation coefficient (R) of -0.011 and weighted average of 80.9%. Similarly, the statistical analysis conducted on geographies consisting of 24,519,269 people shows a moderate negative correlation between the proportion of Nepalese and percentage of population with at least ged/equivalency education in the United States with a correlation coefficient (R) of -0.428 and weighted average of 81.9%, a difference of 1.3%.
GED/Equivalency Correlation Summary
| Measurement | Cape Verdean | Nepalese |
| Minimum | 61.1% | 64.2% |
| Maximum | 99.3% | 94.3% |
| Range | 38.1% | 30.1% |
| Mean | 82.7% | 80.3% |
| Median | 83.4% | 82.3% |
| Interquartile 25% (IQ1) | 77.6% | 75.9% |
| Interquartile 75% (IQ3) | 88.1% | 85.5% |
| Interquartile Range (IQR) | 10.5% | 9.6% |
| Standard Deviation (Sample) | 7.9% | 7.4% |
| Standard Deviation (Population) | 7.8% | 7.4% |
Demographics Similar to Cape Verdeans and Nepalese by GED/Equivalency
In terms of ged/equivalency, the demographic groups most similar to Cape Verdeans are Nicaraguan (80.9%, a difference of 0.0%), Belizean (80.9%, a difference of 0.020%), Immigrants from Guyana (81.0%, a difference of 0.040%), Native/Alaskan (80.9%, a difference of 0.040%), and Immigrants from Ecuador (81.0%, a difference of 0.10%). Similarly, the demographic groups most similar to Nepalese are Vietnamese (81.9%, a difference of 0.030%), Immigrants from St. Vincent and the Grenadines (82.0%, a difference of 0.060%), Immigrants from Bangladesh (81.9%, a difference of 0.070%), Ute (81.8%, a difference of 0.17%), and Ecuadorian (81.7%, a difference of 0.30%).
| Demographics | Rating | Rank | GED/Equivalency |
| Immigrants | St. Vincent and the Grenadines | 0.0 /100 | #294 | Tragic 82.0% |
| Nepalese | 0.0 /100 | #295 | Tragic 81.9% |
| Vietnamese | 0.0 /100 | #296 | Tragic 81.9% |
| Immigrants | Bangladesh | 0.0 /100 | #297 | Tragic 81.9% |
| Ute | 0.0 /100 | #298 | Tragic 81.8% |
| Ecuadorians | 0.0 /100 | #299 | Tragic 81.7% |
| Fijians | 0.0 /100 | #300 | Tragic 81.6% |
| Dutch West Indians | 0.0 /100 | #301 | Tragic 81.6% |
| Immigrants | Haiti | 0.0 /100 | #302 | Tragic 81.6% |
| Immigrants | Portugal | 0.0 /100 | #303 | Tragic 81.6% |
| Navajo | 0.0 /100 | #304 | Tragic 81.5% |
| Immigrants | Grenada | 0.0 /100 | #305 | Tragic 81.3% |
| Guyanese | 0.0 /100 | #306 | Tragic 81.3% |
| Immigrants | Dominica | 0.0 /100 | #307 | Tragic 81.1% |
| Puerto Ricans | 0.0 /100 | #308 | Tragic 81.1% |
| Immigrants | Ecuador | 0.0 /100 | #309 | Tragic 81.0% |
| Immigrants | Guyana | 0.0 /100 | #310 | Tragic 81.0% |
| Natives/Alaskans | 0.0 /100 | #311 | Tragic 80.9% |
| Nicaraguans | 0.0 /100 | #312 | Tragic 80.9% |
| Cape Verdeans | 0.0 /100 | #313 | Tragic 80.9% |
| Belizeans | 0.0 /100 | #314 | Tragic 80.9% |