Immigrants from Burma/Myanmar vs Korean GED/Equivalency
COMPARE
Immigrants from Burma/Myanmar
Korean
GED/Equivalency
GED/Equivalency Comparison
Immigrants from Burma/Myanmar
Koreans
83.0%
GED/EQUIVALENCY
0.2/ 100
METRIC RATING
268th/ 347
METRIC RANK
85.6%
GED/EQUIVALENCY
41.2/ 100
METRIC RATING
178th/ 347
METRIC RANK
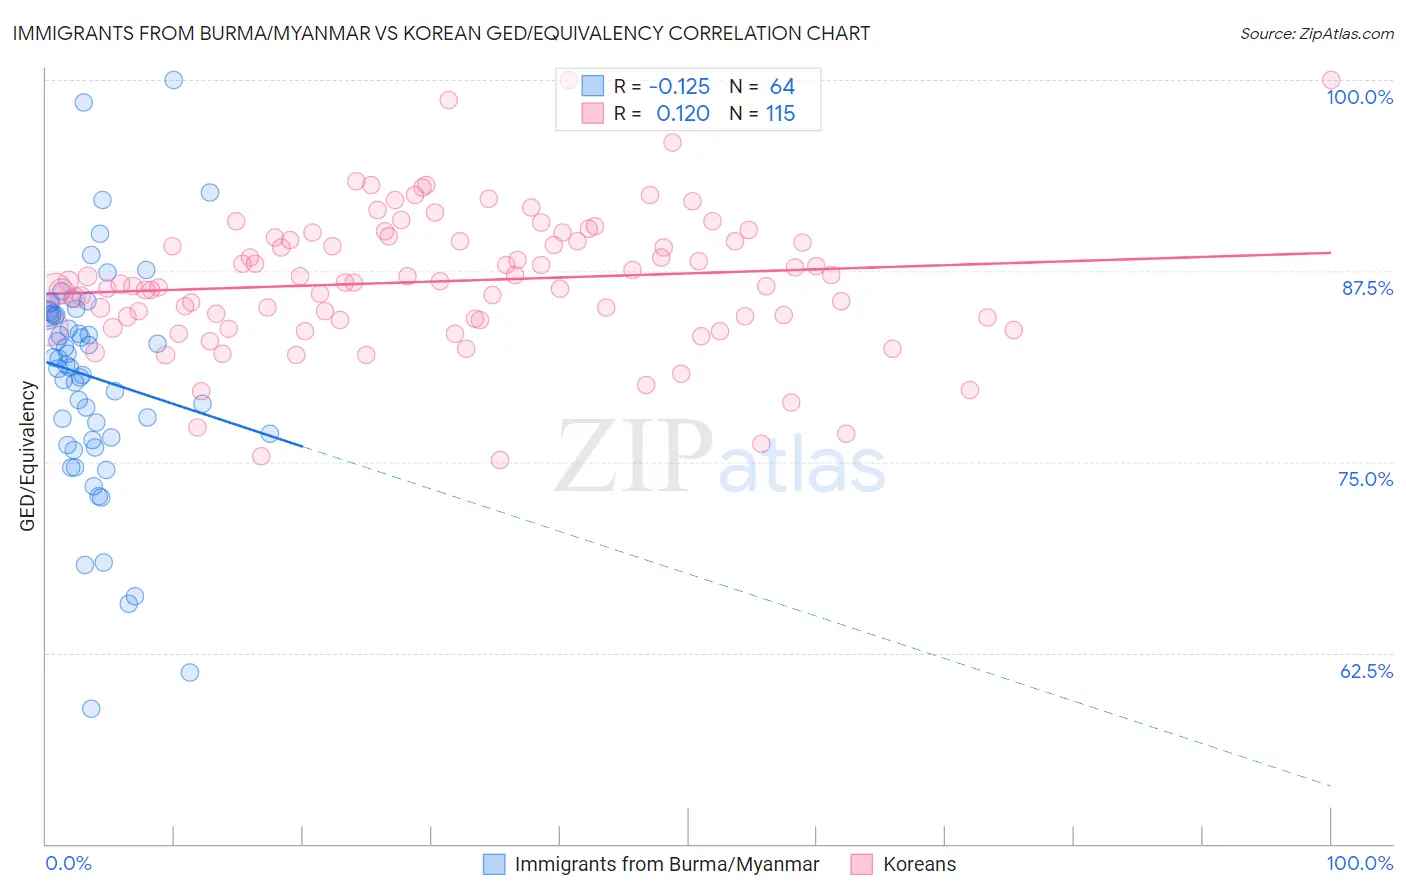
Immigrants from Burma/Myanmar vs Korean GED/Equivalency Correlation Chart
The statistical analysis conducted on geographies consisting of 172,357,706 people shows a poor negative correlation between the proportion of Immigrants from Burma/Myanmar and percentage of population with at least ged/equivalency education in the United States with a correlation coefficient (R) of -0.125 and weighted average of 83.0%. Similarly, the statistical analysis conducted on geographies consisting of 510,944,156 people shows a poor positive correlation between the proportion of Koreans and percentage of population with at least ged/equivalency education in the United States with a correlation coefficient (R) of 0.120 and weighted average of 85.6%, a difference of 3.1%.
GED/Equivalency Correlation Summary
| Measurement | Immigrants from Burma/Myanmar | Korean |
| Minimum | 58.8% | 75.1% |
| Maximum | 100.0% | 100.0% |
| Range | 41.2% | 24.9% |
| Mean | 80.5% | 86.8% |
| Median | 81.5% | 86.8% |
| Interquartile 25% (IQ1) | 76.5% | 84.3% |
| Interquartile 75% (IQ3) | 84.7% | 89.5% |
| Interquartile Range (IQR) | 8.1% | 5.2% |
| Standard Deviation (Sample) | 7.5% | 4.5% |
| Standard Deviation (Population) | 7.4% | 4.5% |
Similar Demographics by GED/Equivalency
Demographics Similar to Immigrants from Burma/Myanmar by GED/Equivalency
In terms of ged/equivalency, the demographic groups most similar to Immigrants from Burma/Myanmar are Trinidadian and Tobagonian (83.0%, a difference of 0.040%), Hopi (83.0%, a difference of 0.040%), West Indian (83.1%, a difference of 0.060%), Kiowa (83.1%, a difference of 0.060%), and Bangladeshi (83.1%, a difference of 0.070%).
| Demographics | Rating | Rank | GED/Equivalency |
| Inupiat | 0.2 /100 | #261 | Tragic 83.1% |
| Immigrants | Armenia | 0.2 /100 | #262 | Tragic 83.1% |
| Immigrants | Congo | 0.2 /100 | #263 | Tragic 83.1% |
| Bangladeshis | 0.2 /100 | #264 | Tragic 83.1% |
| West Indians | 0.2 /100 | #265 | Tragic 83.1% |
| Kiowa | 0.2 /100 | #266 | Tragic 83.1% |
| Trinidadians and Tobagonians | 0.2 /100 | #267 | Tragic 83.0% |
| Immigrants | Burma/Myanmar | 0.2 /100 | #268 | Tragic 83.0% |
| Hopi | 0.2 /100 | #269 | Tragic 83.0% |
| Immigrants | Jamaica | 0.2 /100 | #270 | Tragic 82.9% |
| U.S. Virgin Islanders | 0.2 /100 | #271 | Tragic 82.9% |
| Barbadians | 0.1 /100 | #272 | Tragic 82.9% |
| Pennsylvania Germans | 0.1 /100 | #273 | Tragic 82.9% |
| Immigrants | Trinidad and Tobago | 0.1 /100 | #274 | Tragic 82.8% |
| Seminole | 0.1 /100 | #275 | Tragic 82.8% |
Demographics Similar to Koreans by GED/Equivalency
In terms of ged/equivalency, the demographic groups most similar to Koreans are Aleut (85.6%, a difference of 0.020%), Immigrants from Southern Europe (85.5%, a difference of 0.060%), Immigrants from Uganda (85.7%, a difference of 0.080%), Moroccan (85.5%, a difference of 0.080%), and Immigrants from Eastern Africa (85.7%, a difference of 0.13%).
| Demographics | Rating | Rank | GED/Equivalency |
| Immigrants | Chile | 57.3 /100 | #171 | Average 85.9% |
| Bermudans | 55.1 /100 | #172 | Average 85.8% |
| Immigrants | Venezuela | 50.7 /100 | #173 | Average 85.8% |
| Ottawa | 50.0 /100 | #174 | Average 85.8% |
| Immigrants | Bolivia | 49.8 /100 | #175 | Average 85.8% |
| Immigrants | Eastern Africa | 47.7 /100 | #176 | Average 85.7% |
| Immigrants | Uganda | 45.2 /100 | #177 | Average 85.7% |
| Koreans | 41.2 /100 | #178 | Average 85.6% |
| Aleuts | 40.5 /100 | #179 | Average 85.6% |
| Immigrants | Southern Europe | 38.4 /100 | #180 | Fair 85.5% |
| Moroccans | 37.7 /100 | #181 | Fair 85.5% |
| Sudanese | 35.2 /100 | #182 | Fair 85.5% |
| Immigrants | Sudan | 34.2 /100 | #183 | Fair 85.5% |
| Immigrants | Oceania | 33.6 /100 | #184 | Fair 85.5% |
| Spanish | 32.8 /100 | #185 | Fair 85.4% |